Kees Dekker: Centamin Plc: Get Out While the Going is Good: Again
- Introduction
Here is another interesting analysis by my fellow countryman Kees Dekker, and it is about Centamin Plc, the Egyptian gold producer. Notwithstanding the omnipresent jurisdiction risk (in my view Kees has been generous with a NPV discount of 5%, which is acceptable for running operations in top 20 Fraser Survey jurisdictions, however Egypt doesn't belong there, it doesn't even have a rating), Kees shows why Centamin might be facing challenges regarding grade and production (this might even be a case of ongoing grade variance when looking at mined grades vs reserve grades), and might be severely overvalued. It is quite a long read as usual, but it gives a good impression of the actions and communications of management, and of Centamin as an investment in my view.
All presented charts are provided by Kees Dekker, unless stated otherwise.
All pictures are company material, unless stated otherwise.
- Executive Summary
This is an update of a report published on Seeking Alpha (“SA”) that went out under the title “Get Out While the Going is Good and earned the classification of Top Idea from SA. This valuation report, completed in November 2015, concluded that the best times were past for Centamin, with the company facing, among others, higher operating expenses associated with an increase in strip ratio and having to share the net free cash flow equally with its Egyptian parastatal partner.
The conclusion proved to be wrong in the short term with the share price appreciating in line with an improving gold price and the market not giving cognisance to the cash flow sharing that would start within two years.
With respect to returning cash to its shareholders Centamin is an extraordinary company. It is one of the very, very few precious metal producers, which has declared decent dividends upon becoming cash positive and without later returning to its shareholders for funding, wiping out all that was previously disbursed. Its stated policy is to declare dividends of at least 30% of its Sukari cash flow, subject to maintaining a minimum cash balance of US$250 – US$300 million. However, during 2018 the company has been overly generous in paying out cash, resulting in a rapidly dropping cash balance, now reaching the lower limits of the target range.
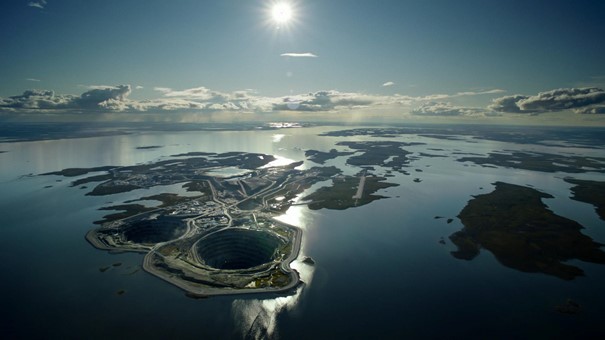
The Sukari mine in Egypt is the sole cash generator for Centamin. The mine has a long-term (+20 year) open pit component, generating approx. 60% of the contained gold, and an underground component which has an unknown mine life, depending on the success of replenishing reserves.
The recent drop in the cash balance is partially due to 2018 operational performance having taken a turn for the worse. In particular the feed grade of both open pit and underground sources has dropped dramatically. This precipitated the current update of the Centamin valuation to determine whether something has fundamentally changed, or whether the 2018 performance is a temporary setback.
Review of the historical operational performance shows gold production peaking in 2016 when relatively high mill grade combined with much higher plant throughput following completion of plant expansion in 2014. The cash balance also peaked in that year at just below US$400 million. Since 2016 gold production has been dropping, coinciding with the company paying out much higher dividends to shareholders and profit share to the Egyptian parastatal partner. The payout ratio during the first nine months of 2018 is unsustainable at almost 230% of cash generation and shareholders must expect deep cuts in the near future unless the operational performance dramatically improves, or the gold price jumps sharply.
The average grade of the open pit resources is heavily influenced by a few high-grade values. The 2015 resource estimation uses multiple indicator kriging (“MIK”) using composite grades without cutting high-grade values. MIK results are greatly influenced by assumptions for the highest-grade range and the achievability of selective mining. The latest reserve estimate effective 30 June 2017 is based on resources using the same approach as in 2015.
Given the progressive drop in open pit grades since start of mining to well below reserve grades and constantly surprising management negatively there seems to be a fundamental problem with production planning. For this reason this valuation considered two open pit reserve scenarios:
- The current grade problems are temporary and life of mine (“LOM”) production will be mining open pit ore that reflect at 1 January 2019 the estimated reserves at 30 June 2017, depleted for production between 1 July 2017 and 31 December 2018 (the “Depleted 2017 Reserve” scenario).
- The current grade problems are structural and the reserves at 1 January 2019 need to be amended. This valuation assumed an amendment in line with the difference between production guidance for 2018 and actual production, which show 21% lower grade (at 0.55 g/t Au versus 0.70 g/t planned) and 29% lower strip ratio (at 2.13 versus 3.0 planned) (the “Amended Reserve” scenario).
With the dearth of information provided by Centamin, this valuation had to model future production simplistically at constant mill grade equal to reserve grade and a guesstimated strip ratio profile, which accounts for a tail off towards open pit reserve depletion. Forecast operating expenditure is based on reported 2018 unit rates, but ignoring the effect of reducing mining cost by capitalising stockpiled material. Future capital expenditure has also been based on actual 2018 levels, in particular underground mine development expenditure. Given these limitations Figure 2_1 with the forecast net free cash flow using the gold price of US$1,248/oz on 7 December 2018 must see as very indicative only.
The diagram shows a large drop in the net free cash flow upon closure of the underground operations in 2028 for both scenarios with under the Amended Reserve scenario even negative cash flow before the strip ratio starts dropping towards the end of the LOM. The importance of underground mining on overall cash generation and the very negative implication on the Amended Reserve scenario are illustrated in the table below.
The table illustrates low cash margins for the open pit mining, which is due to high strip ratios for low-grade material.
This valuation has assumed underground reserves sufficient to sustain production into 2028. The two largest risks associated with Centamin are inability to prove up substantially more underground reserves than currently available and the MIK resource model being wrong about block grades and/or achievable selectivity of mining.
The cash flow generated in the table above after deducting capital expenditure and profit share gives a net present value (“NPV”) discounted at 5% of US$830 million assuming reserves based on the June 2017 estimation and US$534 million assuming the Amended Reserves. Comparing these numbers to the Enterprise Value of US$1,140 million (equivalent to C$1,519 million), using the share price on 7 December 2018, shows Centamin is overvalued.
It is therefore safe to conclude, despite all uncertainties associated with the cash flow forecasts, that Centamin is currently severely overvalued.
Hence the title of this report: Get Out While the Going is Good – Again.
3. Introduction
3.1 Introduction to Centamin
Centamin Plc (“Centamin”), is an Australian mining and mineral exploration and development company that has been actively exploring in Egypt since 1995. The principal asset of Centamin is its 50% interest in the Sukari Mine, located in the Eastern Desert of Egypt, which started operating in mid 2009.
Centamin is listed on the Toronto Stock exchange ("TSX:CEE") since 5 April 2007 and on the London Stock Exchange ("LSE:CEY") since November 2009.
The operating company of Sukari is Sukari Gold Mines (“SGM”), and is jointly owned by Pharaoh Gold Mines NL (“PGM”) a wholly owned subsidiary of Centamin, and the Egyptian Mineral Resource Authority (“EMRA”) on a 50/50 basis.
Figure 3_1 gives the location of the mineral holdings of Centamin in Northern Africa:
- Sukari Gold Mine, Egypt – 50% beneficial interest
- Konkera in Burkina Faso – 1.92 Moz Indicated Resources at 1.7 g/t Au and 1.33 Moz Inferred Resources at 1.7 g/t Au.
- Doropo in Cote d’Ivoire – 1.35 Moz Indicated Resources at 1.3 g/t Au and 0.9 Moz Inferred Resources at 1.2 g/t Au.
With a market capitalisation of C$2.0 billion on 2 December 2018 and a book value in the financial statement for the year ending 30 September 2018 of approx. US$36 million for the West African assets, it is evident that the value of Centamin is determined by their interest in the Sukari mine. For this reason this report will only review the Egyptian operations.
3.2 Sources of Information
The main sources of information are the following:
- Centamin, 30 June 2015, Mineral Resource and Mineral Reserve Estimate for the Sukari Gold Project, Egypt.
- Centamin Plc, Management’s Discussion and Analysis for the years 2007 - 2017 and for the September quarter 2018.
- Centamin Plc, Annual Financial Statements for the years 2007 - 2017 and for the September quarter 2018.
- Corporate Presentation – Site Visit, September 2018.
- Various Press Releases.
- TSX stock information.
4. Looking Back At The 2015 Valuation
4.1 Findings of the Review and Valuation
Based on the 5 year plan published in 2015 and the long term schedule in the 2015 feasibility study the study concluded:
- The company’s strong cash generation was due to a combination of underground production with very good margins, open pit mining at low stripping ratios, income tax exemption and profit sharing deferred until investments.
- It had the good fortune of bringing the mine into operation just when the gold price rose sharply from US$1,000/oz to above US$1,600/oz in the period mid 2011 until end 2012.
- The historical performance is as good as it gets as all the positive factors mentioned in the previous bullet points would come to an end within the next few years.
- Management has put a gloss over this in their 5-year production plan, artificially holding down the strip ratio and assuming continuation of underground mining at a very high level, without having the mineral reserves to sustain this.
- Should this 5-year plan be implemented, the life of the operation will be curtailed to only these five years, because of the subsequent need for much higher waste stripping to access remaining ore blocks, unless there is a major increase in the gold price.
Accounting for the subsequent much higher strip ratio, the forecast net free cash flow had a discounted value much lower than the Enterprise Value of US$969 million at the time.
4.2 Developments Since the 2015 Valuation
The valuation was published on Seeking Alpha earning it a “Top Idea” rating. After it came to the attention of Centamin management, correspondence and a telephone conversation ensued in which the company tried to point out that the conclusions and working were wrong.
From the discussions it became apparent that the valuation did deplete underground reserves too fast as plant feed from development was actually material not included in reserves. The misunderstanding came about as the company reported this as “Ore mined from development”, which should rather be referred to as “Plant feed not included in Reserves”. It meant that the 2015 valuation severely underestimated the life of mine of underground operations, assuming depletion in 2018 based on the 2015 reserve estimation.
According to Centamin the forecast increase in stripping would not happen as the five year production plan kept up with the long term overall stripping requirement of 5.87 tonne waste for 1 tonne ore. This statement was made despite the strip ratios shown in the 5-year plan to be peaking at 6.1 in 2016 and dropping thereafter to 4.2 by 2019. By mining below the average June 2015 reserves strip ratio of 5.87, pure mathematically the strip ratio associated with the reserves remaining at 1 January 2019 would increase to 6.71. As waste stripping need to advance faster in the early years, the consequence of the five-year plan was a stripping rate of at least 7.5 in the years immediately following 2019. A request to Centamin to prove this conclusion wrong by providing full information on sources of plant feed and waste movements went unanswered.
Shareholders who would have followed the advice in November 2015 that the best was past for Centamin and sold out will have regretting this as is evident from Figure 4.2_1.
The Centamin share price rose from C$1.32 at publication date of the 2015 valuation report to C$2.95 by August 2016, greatly assisted by a sharp increase in the gold price over the period. This is only part of the story as Centamin also subsequently did well trading between C$2 and C$3 until recently.
This report will indicate, that the share performance is probably explained by the market not giving sufficient recognition of the impending profit sharing, which the 2015 valuation report warned about, and the market ignoring until 2018 the implications of the downward trend in gold grades.
5. Operational and Financial Performance
Table 5_1 summarises the historical operational and financial performance of Centamin as from June 2003. In 2007 the company changed the currency of accounts from Canadian to US Dollar, which has been ignored and the numbers simply added for simplicity. This is the reason why the calculated cumulative increase in cash generated ($232.1 million) does not totally reconcile with the increase in cash balance ($229.5 million) over the period.
Table 5_1 illustrates operationally:
- The Sukari mined has produced 3.15 million ounces (“Moz”) since start of production in 2009. Of the contained metal mined almost 60% is from the open pit and the balance from underground.
- Mined production and milled throughput show a consistent upward trend with peak production in the first 9 months of 2018.
- However, open pit grades have been almost consistently dropping, with the trend accelerating since 2016. The grade of underground production has similarly dropped sharply since 2016.
- The drop in grade explains why peak gold production was achieved in 2016 despite increasing milling rates in the years thereafter.
Table 5_1 illustrates financially;
- The mine generated cash from operations at an average of 45% of the revenue. This has been maintained in the first 9 months of 2018. However, after deducting investments the net cash generated has dropped sharply in 2018 as shown in Figure 5_1.
- Shareholders have contributed $500 million to developing the mine and have received hitherto US$419 million back as dividends. It should be noted that this project, which must be considered to compare very favourable to other projects, has after nine years not yet repaid its investment on an undiscounted basis. This again shows how difficult it is for mining companies to provide returns on a cash flow basis.
- The quoted cumulative dividends have been achieved partially by returning more cash to the shareholders than the operation can afford on a sustainable basis as evident from the drop in cash balances since 1 January 2017.
- In the light of the dividend policy expressed in the corporate presentation dated September 2018, which states a “minimum dividend of 30%, subject to maintaining a minimum cash balance of US$250-US$300 million”, shareholders must expect a severe cut in future dividends unless there is a major operational improvement or rise in gold price.
- The amount of cash available for shareholders is additionally negatively affected by the increasing share of EMRA in cash generated. Figure 5_2 shows the proportion of cash paid out (left vertical axis) and the distribution of between shareholders and EMRA (in US$ on right axis).
- In 2018 dividends of US$193 million and profit share of US$66 million, both annualised numbers to allow for comparison with previous years, amount to 230% of total net cash generated with dividends running well ahead of EMRA’s share.
In conclusion, after very good historical performance, the mine and company seem to have hit upon much harder times. The following sections will review the operation to determine whether its current problems are of a short-term nature, or if there has been a structural change.
Based on the findings of Section 6, Centamin will be valued in Section 7 purely on the basis of the Sukari operation and ignoring the West African project as minor in the context of the company, with the determined net present value discounted at 5% compared to the Enterprise Value established in Section 8 and Section 9 giving general conclusions.
6. Background To The Sukari Mine
6.1 Location and Tenure
Unless specifically otherwise stated, all technical information, illustrations and wording is contained in a NI.43-101 report by Centamin, using outside consultants as well, dated 16 June 2015 in support of an updated reserve estimation.
The Sukari project (Figure 6.1_1) is located in Egypt in the arid Eastern Desert some 30 km of Marsa Alam on the Red Sea.
A coastal highway runs along the west coast of the Red Sea from the border with Sudan in the south to Suez in the north, passing through Marsa Alam. From Cairo to Marsa Alam by highway is about 750 km, about ten hours by supply truck. From Marsa Alam the mine is reached by a combination of 20 km bitumen highway and 12 km gravel road.
There is a new international airport north of Marsa Alam.
Figure 6.1_2 shows the extent of the Sukari concession area, which covers an area of 160 km2, containing the Sukari mine site and surrounding prospects.
Centamin holds in interest in Sukari through its wholly owned subsidiary Pharaoh Gold Mine (“PGM”), through an agreement (“the Concession Agreement), executed in 1994 with the Egyptian Geological Survey and Mining Authority (“EGSMA”, now the “EMRA) and the Egyptian government. The Concession Agreement was declared into Law 222 of 1994 and came into effect on 29 January 1995.
In accordance with the Concession Agreement, a “Commercial Discovery” was declared in November 2001 following the submission of a feasibility study by PGM; EMRA and PGM then agreed on the borders of the area to be converted from exploration to exploitation lease comprising an area of 160 km2. The Minister of Petroleum approved a 30-year lease in respect of 160 km2 on 24 May 2005, extendable for a further 30 years upon PGM providing appropriate commercial justification.
Following demonstration of the commercial discovery, PGM and EMRA were required to establish an operating company in which each party holds 50%. This company, SGM, was incorporated under the laws of Egypt on 13 April 2006 to conduct exploration, development, exploitation and marketing operations in accordance with the Concession Agreement. Responsibility for the day-to-day management of SGM rests with the Sukari General Manager who is appointed by PGM.
It should be noted that the validity of the exploitation lease is currently the subject of litigation in the Egyptian courts, after the Administrative Court nullified the exploitation lease in October 2012, except for an area of 3 km2, which is now on appeal and with both the current authorities and Centamin contesting as being without merit.
6.2 History Of The Sukari Project
In 1994, PGM negotiated an exploration and mining agreement (Concession Agreement), with the Egyptian Geological Survey and Mining Authority (EGSMA; now the Egyptian Mineral Resources Authority (EMRA)) and the Egyptian Government, to explore for gold and associated minerals in the Eastern Desert of Egypt. The Concession Agreement was declared into Law 222 of 1994 and came into effect on 29 January 1995 pursuant to which PGM had the right to explore and develop gold and associated metal deposits within the concession.
Work by PGM commenced in 1995 with the establishment of a camp and exploration work that culminated in drilling with the first programme commencing in April 1997.
In 2001, the first resources estimated by an independent party were declared, updated in April 2003 to 1.7 million ounces in the Measured and Indicated category using a cut-off grade on 0.5 g/t Au. After having successfully proven substantial quantities of ore, an open pit and underground mining operation was developed, which commenced commercial production in the middle of 2009.
Exploration and delineation drilling has continued uninterrupted resulting in a continuous increase of Measured and Indicated Resources until 2011 (see Figure 6.2_1, extracted from a Centamin corporate presentation dated September 2018).
After 2011, on-mine exploration drilling has not been successful at replacing resources depleted through mining. The effect of drilling is mostly noticeable at increasing confidence levels in the available resources.
6.3 Geology Of Project Area
The unit that hosts the gold deposit is an intrusive that is 2.3 km long and 100 m to 600 m thick. Drill results indicated that the intrusive dips between 50° and 75° to the east. Four geographical zones have been designated from north to south: Pharaoh, Gazelle, Ra and Amun (Figure 6.3_1).
From field observation and core logging, it is evident that the Sukari intrusive has acted as a rigid body surrounded by weaker rocks when tectonic deformation took place. Footwall and hanging wall rocks have taken up strain by development of strong schistosity, almost certainly accompanied by large decreases in volume. The porphyry has taken up strain by development of predominantly brittle fault structures. These acted as conduits for the fluids that contained the gold.
Gold mineralisation within the Sukari intrusive is not continuous and its deposition has been influenced by major long-lived structures, the most important of which are tabular sheets of crackle breccia referred to as the Main Reef and Hapi Reef.
Figure 6.3_2 shows the two reef zones dipping within the host rock at a shallower angle (i.e. 35° to 50° east) than the Sukari intrusive itself.
A large volume of mineralisation is also associated with stacked brittle veins. These occur in zones proximal to the through-going mineralised shears, but they also occur remote from them.
Figure 6.3_3 is a copy of a slide in the September 2018 corporate presentation, showing a longitudinal section through the Sukari deposits with the Cleopatra area most southerly followed by the Ptah area in the centre and Amun in the north, somewhat confusing using other designations from those in Figure 6.3_1.
Gold mineralisation at Sukari is intimately related to sulphides; pyrite is the most abundant sulphide, followed by arsenopyrite. High gold grades are associated with increased arsenopyrite concentration. Scanning Electro Microscope (“SEM”) and mineralogical work, determined that high-purity gold occurs free in quartz, on the margins of pyrite and arsenopyrite crystals, and as micro-fracture filling.
This points to a high proportion of gold being amenable to cyanide leaching after milling without requiring more expensive methods to unlock the gold.
6.4 Geological Modelling and Estimated Resources
At the time of writing the 2015 feasibility study report, the Sukari resource drill hole database comprised approximately 579,319 m of drilling in 1,892 holes, including some holes abandoned because of drilling difficulties and some intervals that are awaiting assays.
Figure 6.4_1 shows the collar locations of the boreholes drilled from surface, illustrating the dense nature of the borehole pattern with an average drill hole spacing of 20 m in the grid east direction and 25 m in the grid north direction.
Due to very large variability in the sample results compared to average grade (the so-called co-efficient of variation “CV” being higher than 2.0), resource estimation using ordinary kriging (“OK”) or inverse distance (“ID”) weighting were deemed inappropriate by MPR Geological Consultants (Pty) Ltd (“MPR”) and Multiple Indicator Kriging (“MIK”) was applied. MIK is a method developed to deal with sample grades that show extreme variation and where estimates of grade show extreme sensitivity to a small number of very high grades.
The basic unit of an MIK block model is a panel that normally has the dimensions of the average drill hole spacing in the horizontal plane. At Sukari, the average drill hole spacing is 20 m in the grid east direction and 25 m in the grid north direction. The parent cell dimension for he resource model has therefore been chosen as 25 m x 20 m x 5 m vertical. The panel should be large enough to contain a reasonable number of blocks (about 15) or Selective Mining Units (“SMU”), being the maximum selectivity possible given the equipment size used for mining. For Sukari a SMU size of 5 m x 8 m by 10 m high was assumed.
Of interest is that it was found that the CVs are very high for the southern porphyry (7.0 and 11.70, compared to the 2.0 mentioned in the paragraph below Figure 6.4_1) indicating that the average grade is very much determined by a few very high grade sample results and the estimation method and assumptions will have a great impact on block grade estimates.
It is beyond the scope of this report to explain MIK, suffice to know that the small changes in the assumptions related to high grade results will have an important impact on the resource grades and practicality of selective mining.
For the estimation of underground resources, Cube Consulting Pty Ltd (“Cube”) defined the outlines of 46 deposits, referred to as domains, and carried out data analysis for each of those on the basis of which it defined appropriate high-grade cuts for each domain. Instead of using MIK, Cube used one single indicator with threshold defined at 5 g/t Au as criterion to estimate gold for each mineralisation domain.
Table 6.4_1 presents the resource estimate by MPR and Cube as per June 2015, below which the latest available resources are given as reported by Centamin, effective 30 June 2017, but without supporting technical report. All block estimates were based on interpolation into 8 m (north) x 8 m (east) x 8 m (vertical) parent cells with sub-celling to 1 m x 1m x 1m.
Not evident from the table is the fact that in 2015 inferred open pit resources comprised only 7% of total open pit resources, but amounted to 55% of total underground resources. By 2017 these proportions had dropped to respectively 5% and 38%.
With open pit inferred resources almost non-existence the prospect for a reduction in strip ratio compared to plan by sending some inferred resources for treatment instead as waste is very slim.
Figure 6.4_2 and Figure 6.4_3 show cross sections through the deposit from south to north, the exact location of the section indicated on the longitudinal section in the top left corner. These cross sections have been extracted from a Centamin site visit corporate presentation dated September 2018 to show the “highlighted drill intercepts during Q2 2018” in Figure 6.3_3 in relation to current resource outlines, indicated in yellow.
Evident from the quoted intersections (supposedly the best results considering they are “highlighted”) is their generally low grade and/or narrow width, which is not supportive of adding these areas to underground resources. Compare the results listed to the intercepts in Figure 6.3_2.
6.5 Mining and Reserves
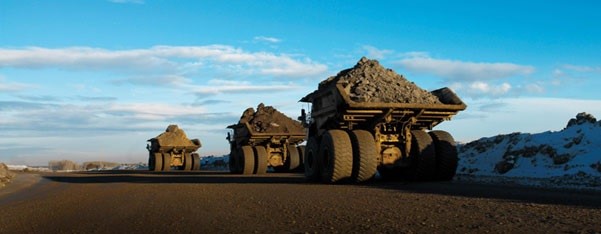
SGM is conducting owner-mining open-pit operations at Sukari and employ Barminco Egypt as a contractor for underground mining.
Ore from open pit mining is hauled to the ROM pad adjacent to the primary crusher. The majority of ore is direct tipped into the crusher, with provision for ore to be stockpiled for reclamation by a front-end-loader operated as part of the crushing and processing operation. Table 6.5_1 gives the assumptions used for the pit optimisation in 2015.
The pit optimisation resulted in the pit shells shown in Figure 6.5_1.
The pit optimisation modelling showed that, while the average grade is fairly constant over the range of pit shells, the mining inventory (tonnage) was very sensitive to gold price. This indicates that the ultimate size of the pit (and therefore reserve ounces) is highly sensitive to gold price and the mining cost assumptions. For example, a drop in the gold price from US$1,300/oz used to the current spot price of US$1,248/oz would remove approx. 30 million tonnes from the ore inventory.
Underground mining is planned to source ore from stopes located within the designed final open-pit, and well above the final pit limits. A volume adjustment representing the stoping component of this 2.7 Mt was made to the resource model to account for the volume to be removed by the underground mineral reserve in advance of later open-pit mining. It should be noted that it will make pit operations later more tricky to prevent machinery dropping into the voids created by underground mining.
The open-pit is to be mined in stages with Stage 1 to 3 complete by 2018. The mining sequence progresses through Stages 4, 5, and 6, with Stage 7 comprising the final pit design. Sub-staging is used by the site when appropriate to meet short-term scheduling objectives (see Figure 6.5_2).
Figure 6.5_3 shows the open pit outline upon completion of mining.
The estimation of underground reserves assumes mining by means of longhole open stoping of the deposit that dip steeper than approx. 50 degrees and cut-and-fill mining of the shallower dipping deposits. A hurdle grade of 3 g/t Au was used. Unplanned dilution is estimate at 10% for cut and fill and 15% for longhole stoping with the material grading respectively 0.8 g/t and 0.4 g/t Au.
Access to the stopes is achieved are by means of two ramps from surface, one from Amun, another from Ptah. Figure 6.3_3 shows that at Cleopatra an exploration decline has been developed after 2015.
Table 6.5_2 summarises the estimated reserves for the open pit and underground operations.
The table shows an overall drop in reserves since June 2015, but with Centamin successfully replenishing some of the depletion, in particularly in the underground category. Replenishing open pit reserves was to some extent assisted by using a lower cut-off grade.
Comparing Table 6.5_2 with Table 6.4_1 shows that the conversion rates of Measured and Indicated resources to reserves for the open pit and underground categories is respectively 60% and 49% in terms of gold content. The open pit reserves have exactly the same grade as resources indicating the unplanned dilution has been ignored. The grade of underground reserves is one third lower, partially explained by the impact of low grade development ore. Excluding this impact, the drop in grade is 25%,.which is surprisingly low in the light of assumed maximum dilution of 15% with material grading 0.4 g/t Au.
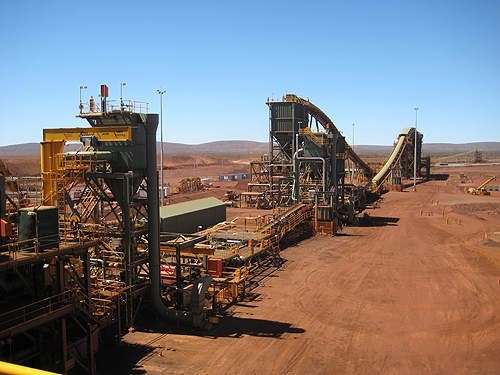
6.6 Processing
The process route used for Sukari ore is crushing, milling to a particle size at which 80% (P80) passes 150 μm, flotation of a bulk sulphide concentrate that is milled finer to P80 12μm before cyanide leaching of the concentrate, adsorption of the gold onto active carbon, after which the precious metals as recovered as a gold doré bar for refining off site. This is a comprehensive process that is not cheap considering the low-grade nature of open pit material.
The plant in its current configuration was constructed in four stages, first for treatment of oxide material at 4.6 Mtpa, then to be able to handle sulphide ore at 4.0 Mtpa, followed by installation of additional secondary crushing capacity to increase production to 5.0 Mtpa, and finally the construction of a parallel circuit that doubles capacity to above 10 Mtpa. The plant is presently achieving throughputs higher than the rated plant capacity.
In parallel with the milling operation, gold from low-grade oxide ore is recovered by dump leaching. In this case ore is directly hauled to a leach pad and sprinkled with a dilute cyanide solution for leaching. The pregnant solution is pumped to a series of carbon columns or to the Stage 1 processing plant.
Table 6.6_1 shows the historical process performance since January 2013.
The table shows a recovery of the CIL process of just below 90% and annual gold production from heap leaching of approx. 10,000 oz.
7. Valuation of Centamin
7.1 Metal Prices and Off-mine Charges
The Base Case gold price is the spot price quoted on 7 December 2018 of US$1,248.oz. The quoted transport and refinery cost for the first nine months of 2018 equates to US$3.3/oz gold sold.
7.2 Production Schedule
The feasibility study documentation is vague in providing the mine production schedule and presents the quantities not in the format of tables but as two diagrams, reproduced in Figure 7.2_1 and Figure 7.2_2.
From the above it is apparent that mill feed would reach 11 Mtpa in 2018 with waste stripping at approx. 8 : 1. The grade over the life of mine is forecast to vary substantially, first dropping in 2018 with cessation of underground mining to increase again with pit deepening. In 2026 until 2028 the grade is low because of the impact of treating low-grade stockpile material. As the pit is deepened further, grades start improving again.
For underground production five years at 1 Mtpa were assumed which according to Centamin “were conceptual in nature, and there has been insufficient exploration to define an underground mineral resource to support the expected life of mine”.
Subsequently a slide in a Centamin corporate presentation dated September 2015 gave the production forecast for the five years ending 2019. Table 7.2_1 compares the actual production since 2015 with the five-year plan in 2015 to determine how well the operation has performed against plan with the number for 2018 annualised nine months production.
In the table the most important variances have been highlighted with planned numbers in yellow and actuals in orange brown. These show the effect of a precipitous drop in grade compensated for by lower stripping ratios. There was obviously something very wrong with the plan and Centamin is glossing over this. In the MDA report for the period ending 30 September 2018 the issue is not addressed at all and the site visit presentation of September 2018 only mentions the transitional zone to be thicker than expected with lower grades. According to the same presentation mining progressed during Q3 out of the transitional zone into “primary ore” in Q4.
According to the production guidance for 2018 given in the MDA report for the year ending 31 December 2017 mining started in 2018 on pit Phase 4A, which was supposed to be at a grade of 0.68 g/t Au and mined at a strip ratio of 3.0. From the much lower actual grade mined and at a much lower strip ratio, it seems that much of the waste was classified as ore. This explains the movement of ore that greatly exceeded plant capacity and requiring stockpiling. In the 9 months of 2018 the CIL plant treated 9.7 million tonnes less material than was mined. This increase may include a certain amount of dump leach material, but Centamin ceased to provide such information in 2018, another example of its inconsistent reporting.
Centamin management was clearly caught off guard and this raises questions about the validity of the block model for Phase 4A. With reference to Section 6.4 certain assumptions used in the MIK block model may be incorrect and have resulted in overestimating average block grades and/or achievable selectivity of mining of Phase 4A.
Of concern is the fact that this pit phase will be the predominant source of open pit ore until June 2021.
The above means that this valuation has to consider two scenarios, being performance as from 1 January 2019 with:
- the reserves as declared at 30 June 2017, depleted for mining up to 31 December 2018 (the “Depleted June 2017 Reserves” scenario).
- reflecting reserves that account for the lesser mining selectivity: more ore at a lower grade and lower strip ratio. Based on the 2018 performance this reduces the grade by 21%. Assuming the total gold content is unaffected the amount of open pit ore increases to 259.3 million tonnes at a grade of 0.76 g/t Au and the strip ratio drops by 26% to 3.94. (the “Amended Reserves” scenario).
The 30 June 2017 underground reserves have been depleted by actual production until 31 December 2018, using for 2018 annualised first nine months performance, by deducting only ore from stoping. The 3.6 million tonnes at 4.68 g/t gold remaining at 1 January 2019 has been arbitrarily doubled, assuming substantial success of future exploration.
It should be noted that this valuation has given Sukari the benefit of the doubt as it could have amended the reserves much more severely. Table 7.2_1 shows that Sukari mines roughly to the 5-year plan of 2015 and is currently in Phase 4A. For 2018 the 5-year plan indicated a grade of 1.07 g/t at a strip ratio of 4.2. The actuals for both are half! If the amendments had reduced remaining reserve grade and strip ratio by half the results would be very severe.
This valuation has accounted for dump leach production of approx. 10,000 oz per annum by simply increasing the overall metallurgical recovery to 90%. Dump leach material is low-grade mineralisation that is placed uncrushed on leach pads and sprinkled with a cyanide solution, yielding enough gold to cover the minimal cost of leaching only.
Table 7.2_2 shows the derived mining schedule for the two reserve scenarios.
The table illustrates that the total gold production is the same for both scenarios, but with clearly lower annual production for the amended reserves, especially after depletion of underground reserves.
7.3 Capital Expenditure
The capital expenditure forecast of the 2015 feasibility study is no longer relevant. Table 7.3_1 gives historical perspective of annual capital expenditure of Centamin as a whole.
The MDA reports give sustaining capital expenditure for “underground development” and “other”. The financial statements give total investment from which expenditure on other items was derived. The number for the full 2018 year has been derived from the guidance in the September 2018 corporate presentation, which gives US$135 million including US$22 million on greenfield exploration.
This valuation has assumed mine development to continue at current rates, ceases abruptly and completely three years before underground mine depletion. Much of “other sustaining” capital expenditure in 2016 and 2017 seems to be related to a major overhaul and replacement of equipment. For this reason annual forecast for items other than underground development has been assumed at half the 2018 amount. This amount has been halved to US$17.35 million per annum upon underground mine closure and to continue until three years before open pit depletion.
7.4 Operating Expenditure
Table 7.4_1 gives the historical financial performance, which was used to establish the operating cost structure of Centamin. Cells highlighted yellow contain numbers quoted in the financial statements and MDA reports.
The operating cost for mining, processing and General and Administration have been derived from the reported numbers in the financial statements for these activities expressed in US$ per ounce. The unit cost for open pit mining and processing show a clear drop between 2015 and 2016, which can be ascribed to economies of scale as production was ramping up. The company also showed good cost control of on-site G&A cost.
The cell highlighted in brown shows unit mining cost after the capitalisation of cost to “inventory” has been reversed. Centamin proudly shows in its September 2018 corporate presentation the unit mining cost dropping below US$1.50, but this is a result of the cost of material mined and stockpiled having been deducted from operating cost.
7.5 Royalties, Taxes and Profit Sharing
Royalty
The Government of Egypt receives a royalty of 3% of net sale revenue, payable in cash each calendar half year.
Income Taxes
Starting from the date of commercial production PGM will enjoy a 15-year exemption from taxes imposed by the Egyptian government. PGM and EMRA also agreed that the operating company will in due course file an application to extend the tax-free period for a further 15 years.
Profit Share
EMRA is entitled to 50% of the “net operating profit surplus”, subject to PGM being entitled to recover the following costs and expenses payable from sales revenue:
- All current operating expenses incurred and paid after the initial commercial production;
- Sustaining capital expenditure recovered in the year it is incurred;
- Growth capital expenditure at the rate of 33.3% per annum.
After deduction of royalty payments and recoverable expenses, the remainder of the sale revenue will be shared equally between PGM and EMRA. There is a phase-in period with profit share to EMRA 40% until June 2018, 45% until June 2020 and 50% thereafter.
Figure 7.5_1 shows schematically the holding arrangement of Sukari Gold Mines.
| Figure 7.5_1
Holding Arrangement of Sukari Gold Mines |
7.6 Working Capital Requirements
The cash flow model assumes that the net current assets at 30 September 2018 of US$326 million, including cash balances, are sufficient and no additional investments are required.
The value of the net current assets for Centamin is accounted for in the derivation of the Enterprise Value in Section 6 of this report.
7.7 Results
Table 7.7_1 summarises the cash flow results for the life of mine for the two reserve scenarios.
The table shows that the Sukari mine has a modest operating margin of 26% to 34% of gross revenue, depending on the reserve scenario. Of the cash generated before re-investments and profit share respectively 22% and 35% reach the bottom line for distribution to Centamin shareholders.
The reason why the discounted values do not differ much from undiscounted net free cash flow is found in the timing of the cash flow as shown in Figure 7.7_1.
The diagram shows a large drop in the net free cash flow upon closure of the underground operations with under the amended reserve scenario even negative cash flow before the strip ratio starts dropping towards the end of the LOM.
The absolute numbers in the diagram should not be taken as gospel as these are derived using rough assumptions for waste stripping and with the grade held constant at reserve grade. The 2015 feasibility study schedule showed open pit grades improving towards the end of LOM. If applicable the annual cash flows in the earlier years are overstated and in the later years understated.
The reason why the above illustration was generated is to emphasise the importance of underground production for the financial performance of Centamin.
Table 7.7_2 compares the cash generation for underground mining and open pit mining for both reserve scenarios.
The table shows the relative importance of the underground operation to contributing to overall net free cash flow. Open pit mining is a relatively low margin operation due to high strip ratios for low-grade plant feed. The table also shows the large effect on overall cash flow should it be proven that the Amended Reserves scenario applies.
The relatively low reduction in discounted value compared to undiscounted net free cash flow is due to 78% of the NPV5 value (85%-88% of NPV10 value) accruing in the first ten years when underground operations are assumed to occur.
The two largest risks associated with Centamin are inability to prove up substantially more underground reserves than currently available and the MIK resource model being wrong about block grades and/or achievable selectivity of mining.
Table 7.7_3 expresses the sensitivity of the project value as the change in Net Present Value per percentage point change in the economic main parameters.
As examples of how the table should be read, for every percentage point increase in gold price (i.e. US$12.5/oz) the NPV5 increases by US$30.4 million for the Depleted 2017 Reserves scenario and US$28.4 million for the Amended Reserves scenario.
The financial performance of Centamin is highly leveraged to the gold price with NPV5 changing by 5.5% for every percentage point change in the gold price.
For every percentage point increase in the open pit mining cost (i.e. US$0.017/t) the NPV5 drops by respectively US$7.6 million and US$7.5 million. The much lower sensitivity of the open pit mining cost compared to gold price changes is partially due to the large impact of cash flow from underground mining.
8. Enterprise Value of Centamin and 7 December 2018
At a share price of C$1.67 on 7 December 2018 the company has with 1,154.7 million shares (according to the TSX) a market capitalisation of C$1,928.4 million, which at the exchange rate on that day of C$1.33 per US Dollar equals US$1,447.7 million. According to the quarterly statements for the period ending 30 September 2018 there are no warrants outstanding and the only share options applicable relate to 0.84 million “awards” to employees, which may take the form of nil cost options or have a nominal exercise price and are subject to satisfying applicable performance conditions.
At the end of the quarter the company had net current assets amounting to US$307.7 million, ignoring the mining stockpile value and provision for obsolete stores, and was debt free.
The Enterprise Value assuming no dilution through the exercise of the options is as follows:
US$ million
Market Capitalisation 1,447.7
Plus: Loans -
Cash at Banks and on Hand (307.7)
Enterprise Value 1,140.0
The Enterprise Value is therefore 1.37 times the NPV5 value for the Depleted 2017 Reserve scenario and 2.25 times the NPV5 of the Amended Reserve scenario.
When the Enterprise value is expressed as value of per attributable reserve ounce (50% of total), it amounts to US$279, which is generous in the current market.
9. Conclusions
The following general conclusions can be drawn:
- Centamin’s value is essentially determined by its 50% interest in the Sukari operation.
- The mine is cash generative at the current gold price, allowing for return of funds to shareholders as dividends.
- The good cash performance is due to a combination of underground production with very good margins and open pit mining at the current low stripping ratio.
- The company has recently been overly generous at paying out cash generated, resulting in a rapidly dropping cash balance, which is now at the lower limit of the stated target level.
- There are serious concerns about the validity of the open pit reserves based on a resource model using MIK as estimation technique. When amending the reserves based on actual versus planned 2018 open pit performance, the average grade drops 21% to 0.76 g/t Au and strip ratio 29% to 3.94.
- The two reserve cases can be seen as two extremes with the actual performance possibly in between should the resource model for mining Pit phases 5, 6 and 7 prove to be valid.
- The NPV5’s for the two reserve scenarios are at US$508 million and US$830 million well below the current Enterprise Value of US$1,140 million.
- It is safe to conclude, despite all uncertainties associated with the cash flow forecasts, that Centamin is currently severely overvalued.
This concludes the report by Kees Dekker.
I hope you will find this article interesting and useful, and will have further interest in my upcoming articles on mining. To never miss a thing, please subscribe to my free newsletter on my website www.criticalinvestor.eu, and follow me on Seekingalpha.com, in order to get an email notice of my new articles soon after they are published.
Disclaimer:
The author is not a registered investment advisor, and currently has no position in this stock. All facts are to be checked by the reader. For more information go to www.centamin.com and read the company’s profile and official documents on www.sedar.com, also for important risk disclosures. This article is provided for information purposes only, and is not intended to be investment advice of any kind, and all readers are encouraged to do their own due diligence, and talk to their own licensed investment advisors prior to making any investment decisions.
This newsletter/article is not meant to be investment advice, as Criticalinvestor.eu (from now on website, newsletter, and all persons or organisations directly related to it, for example but not limited to: owner, editor, the Seekingalpha author The Critical Investor, publisher, host company, employees, associates, sponsoring companies) is no registered investment advisor. Therefore it is not intended to meet your specific individual investment needs and it is not tailored to your personal financial situation. This newsletter/article reflects the personal and therefore subjective views and opinions of Criticalinvestor.eu and nothing else. The information herein may not be complete, up to date or correct. This newsletter/article is provided in good faith but without any legal responsibility or obligation to provide future updates.
Through use of this website and its newsletter viewing or using you agree to hold Criticalinvestor.eu harmless and to completely release them from any and all liability due to any and all loss (monetary or otherwise), damage (monetary or otherwise), or injury (monetary or otherwise) that you may incur.
You understand that Criticalinvestor.eu could be an investor and/or active trader, meaning that Criticalinvestor.eu could buy and sell certain securities at all times, more specific any or all of the stocks mentioned in own newsletters/articles and other own content like the Watchlist, Leveraged List, etc.
No part of this newsletter/article may be reproduced, copied, emailed, faxed, or distributed (in any form) without the express written permission of Criticalinvestor.eu. Everything contained herein is subject to international copyright protection. The full disclaimer can be found here.