Kees Dekker Versus Trilogy Metals: An Analysis
- Introduction
This time Kees Dekker analyzed Trilogy Metals, which sports one of the highest grade copper projects worldwide (Arctic). I found Kees' report interesting enough to obtain company feedback, and after a lengthy process of 6 weeks here is the end product for your convenience. Kees found several reasons to increase opex meaningfully compared to the PFS, so as a consequence the post-tax NPV8 came down significantly (from US$1412.7M to US$803.8M @US$3.00/lb Cu), and I estimated the adjusted IRR at 23% (from 33.4%), which are still strong numbers. At a current market cap of US$226M one could argue that Trilogy is undervalued, as Bornite hasn't been taken into consideration yet.
However, Trilogy is using an open pit scenario for Arctic with a high strip ratio because of the poor rock competence, otherwise I believe an underground scenario would have been more profitable for Arctic. As Bornite is very close to Arctic, about 30km away, chances are that the underground resource of Bornite represents similar issues, and the open pit component of Bornite is most likely too low grade to be economic at the moment, as the operating cost of Arctic already outscores estimated Bornite revenues per tonne for both the PFS and Kees' own estimates. The strip ratio for Bornite most likely seems to be lower than Arctic , but not so much for resulting operating cost to be significantly lower than revenues. Therefore I am not inclined to add much value for Bornite, as it is just a leveraged play which needs a higher copper price in my view to be economic. I found the LNG discussion between Kees and Trilogy management very interesting, it seems Arctic is dependent on LNG but hasn't secured access to it yet.
All in all, taking into account the very nordic location for Arctic, PFS stage and several question marks, I believe Trilogy is fair valued at the moment. See for yourself in the following report by Kees Dekker, so you can make up your own mind about this company.
All presented charts are provided by Kees Dekker, unless stated otherwise.
All pictures are company material, unless stated otherwise.
- Executive Summary
This report is an updated review of Trilogy Metals Incorporated ("Trilogy") (NYSE:TMQ) (TSX:TMQ), which was first valuated in April 2017 based on information of a preliminary economic assessment (“PEA”) of the Arctic deposit, followed by an update based on the results of a prefeasibility study (“PFS”) on this project, dated 6 April 2018. Since April 2018 there have been two important developments, the release of an updated resource statement for Bornite, the other major project of Trilogy, and a substantial drop in metal prices. This report in addition benefits from input/commentary provided by Trilogy management about certain issued raised in the April 2018 valuation report.
For ease of reference this report will repeat the background and other aspects of the previous valuation reports so that it can be read as a stand-alone document.
Trilogy is a Canadian-based base metal mining company, that started off on 27 April 2011 as NovaCopper Incorporated, a wholly-owned subsidiary of NovaGold. When it was spun-off from the precious metal holding company it inherited a large tenement area in Alaska with the very high-grade Cu-Zn Arctic project with gold, silver and lead as by-product elements, in addition to the much larger, but lower grade, Bornite project in proximity to the Arctic deposit.
With the split-off the company was endowed with a large amount of cash, which proved sufficient to fund activities for years to come. In addition, management entered into an all-paper deal with Sunward Resources Limited (“Sunward”), owner of the low-grade Tititribi copper-gold project in Colombia and, probably more importantly, sitting on US$19.4 million in cash. In September another company, GoldMining Incorporated (“GoldMining”), acquired the Titiribi project from Trilogy in an all-paper transaction.
In September 2013 a preliminary economic assessment (“PEA”) concluded that mining the Arctic deposit by open pit methods would generate a net present value at 8% discount rate (“NPV8”) of US$537 million requiring an initial investment of US$718 million.
In April 2017 Trilogy entered into an option agreement with South32 Limited (“South32”), a large diversified base metal company, to form option to form 50/50 joint venture (“JV”) exercisable by contributing US$150 million to the JV company, minus certain expenses. The maximum option period is three years during which South32 must fund a minimum US$10 million per year. As part of the agreement to form the joint venture Trilogy has received US$20.8 million from South 32 until now. According to management, they expect to receive the next US$10 million within the next couple of weeks.
In the 6½ years since the split off and up to 31 August 2018 Trilogy only raised a net US$35.7 million from its shareholders. Considering that it helped to increase cash balances to the current US$30.5 million shareholders funding hitherto only covered approx. 11% of what it spent on its activities over that period.
Whereas Trilogy management has hardly called upon shareholders to fund operations and exploration, it has severely diluted their beneficial interest through the Sunward and GoldMining acquisitions and the exercise of warrants/options. The company ended the February 2018 quarter with 180% more shares than at 31 December 2012.
The report with the findings of the PFS was posted on Sedar on 6 April 2018 and has been reviewed for this valuation. Compared to the PEA report the PFS report has included little additional and more detailed information and leaves many substantial improvements over the PEA inputs not properly reconciled or substantiated. However, Trilogy has subsequently clarified a number of issues to the author. The most important of these are:
- An increase of more than 40% in the metal content of the base metals in the Indicated Resources category. Given the very few additional boreholes in the database used, which were anyway mostly infill holes, this increase is purely the result of estimation approach. The PFS is totally quiet on this and does not give a reconciliation with the PEA resources. The increase cannot be explained by the desire to push Inferred resources in the Indicated category, required to be included in a production schedule to be able to declare reserves as the total metal content in all resource categories increased by more than 30%. According to Trilogy management infill holes encountered wider than previously modelled thicknesses and better grades. Considering that only 17 more holes are included than the 135 holes in the database for the PEA resource estimate, such a major impact is surprising for in-fill holes. The absence of reconciliation on such an important change is unsatisfactory. Feedback from Trilogy on this issue indicates that the 2016 resource estimation was less conservative than the 2013 resource estimation, because the infill holes showed the mineralisation within the Indicated resource category to be thicker and more consistent than previously interpreted. Additional mineralised zones were modelled, which previously were excluded.
- The approach to handling the potentially acid generating (“PAG”) waste has been greatly simplified from the approach in the PEA by disposing it together with other waste in one big, unlined waste rock facility. This results in large operating cost and capital cost savings. According to Trilogy, the climate with its low temperatures will result in slow leach kinetics. In addition, any seepage from the facility will be collected in a pond and either used in the plant, or go through a water treatment plant.
- Much improved metallurgical recoveries and concentrate qualities but without the PFS report including the testwork results, announced in a press release dated 19 April 2017, that support these. The cash flow model of the PFS uses a more favourable metallurgical performance than suggested in the text of the PFS. This valuation has ignored the suggested metallurgical performance of the PFS cash flow model.
- Remarkable savings in capital expenditure and operating cost, despite these being expressed in 2017 money terms compared to 2013 money terms in the PEA. The unit power cost has been dropped by almost half assuming the use of liquid natural gas (“LNG”). The current LNG facility at Fairbanks is committed to existing customers. At this stage as there is no spare production capacity in Alaska to supply the project it is deemed imprudent to include the benefit. After benchmarking against an Alaskan open pit operation that is not far away from the Arctic project, Red Dog, this valuation has added 20% to the operating cost provision to make the provisions more credible.
This valuation comes to a much higher net present value NPV compared to the PEA (which was US$215 for NPV8), which is mainly the result of much more plant feed, a higher copper price and a much lower effective tax rate after changes to the US tax regulations.
In addition to the changes in the inputs as stated above under the bullet points, this valuation differs from the PFS cash flow model by including the purchase of the 1% net smelter royalty (“NSR”), incurring corporate office expenses and taking account of the back-in right of NANA, an Alaska Native Corporation, assuming that it will opt for a 15% net profit interest, instead of buying between 16% and 25% into the project.
Based on the above assumptions the diluted enterprise of Trilogy is more than covered. At 14 December 2018 the share price of C$2.46 translates into a fully diluted Enterprise Value of C$313 million, or US$234 million, which is a fraction of beneficial stake in the JV company partially financed by the cash contribution of South32 for exercising its option.
Only the Arctic deposit alone has the potential to generate a net present value at a NPV8 of approx. US$800 million. A recovery in the Cu and Zn prices by 20% (to respectively US$3.34/lb and US$1.42/lb), results in a NPV8 is US$1.28 billion, an improvement of 60%
As the economics of the Arctic project are very robust, even when stressed by increasing the operating cost by 20% above PFS estimates, and the Bornite deposit is shaping up as an attractive bulk mineable deposit, it is highly unlikely that South32 will not exercise its option by April 2020. The JV company will receive US$150 million from South32 plus a maximum of US$5 million per annum Trilogy spends on the Arctic project minus South32 contributions of US$10 million per annum to advance Arctic and Bornite. Assuming that the option will only be exercised in April 2020, the JV company will receive US$135 million. Based on this valuation Trilogy’s share in the option cash contribution and Arctic project are worth at least (using the currently prevailing Cu and Zn metal prices:
½ x (US$135 million + US$803 million) = US$469 million.
The current diluted Enterprise Value of US$234 million is obviously at a very large discount to the intrinsic value of the Arctic deposit alone.
The latest estimated mineral resources for Bornite have grades of 0.98% Cu for open pit type resources and 2.89% for bulk mineable underground resources. At these grades the prospects for high margin operations are very good and with prospective life of mine (“LOM”) revenue of US$11.5 billion, Bornite has the potential to generate higher earnings before interest, taxes, depreciation and amortisation (“EBITDA”) than the Arctic. Therefore, the substantial value of Bornite further underpins the intrinsic value of Trilogy and makes the market discount even more pronounced.
There are a number of risks that are very difficult to quality, the most important the permitting process and conditions eventually attached to approval and the reliance on a state owned company to build the all-important access road. Not having direct control over the start-up date of the project is the biggest uncertainty to the Arctic project. It is however unlikely this will stop South32 exercising its option on acquiring a substantial stake in a very high grade deposits (and much larger, lower grade deposit at short distance of Arctic).
If the actual start of production is in 2025, which is two years later than assumed in this valuation, this would reduce the NPV by 10%-17%, depending on the choice of discount rate for the two years preceding go-ahead decision, still valuing Trilogy at US$410 million to US$430 million, at least 75% above the current diluted Enterprise Value of US$234 million.
This explains the title of this report: A Very Good Investment in the Medium Term for those who are patient enough to wait until April 2020, when the option terminates, and possibly beyond for the permitting process to run its course.
Based on the 2017 valuation the author has taken a considerable exposure in this share.
3. Introduction
This report is an updated review of Trilogy Metals Incorporated ("Trilogy") (NYSE:TMQ) (TSX:TMQ), which was first valuated in April 2017 on the basis of the preliminary economic assessment (“PEA”), updated in April 2018 after the prefeasibility study (“PFS”) had been released on the most advanced project of the company: Arctic, which has here been updated for the share price and metal prices applicable on 14 December 2018 and which has taken into account commentary by Trilogy management on issues raised in the April 2018 report.
Trilogy is a Canadian gold mining company, that started off on 27 April 2011 as NovaCopper Incorporated, a wholly-owned subsidiary of NovaGold. The NovaGold security holders approved on 28 March 2012 that the shares of NovaCopper were to be distributed to NovaGold shareholders as a return of capital. The shares were then listed on the Toronto Stock Exchange (“TSX”) and New York Stock Exchange (“NYSE”) on 25 April 2012.
At the time of the split off NovaCopper owned the Ambler project in Northwest Alaska and the rights to the adjacent property, referred to as Bornite Lands, through an exploration and option agreement with an Alaska Native Corporation, Nana Regional Corporation Incorporated (“NANA”). The Ambler project had been purchased by Novagold in December 2009 from two Kennecott subsidiaries in 2009 for US$24 million in cash and US$5 million in Novagold shares. The two properties, Arctic and Bornite, combined were from then on referred to as the Upper Kobuk Mineral Projects (“UKMP”).
In February 2012, before the listing, a preliminary economic assessment (“PEA”) had been completed on the Arctic deposit within the Ambler project area based on 30.8 million tonnes (“Mt”) of Indicated and Inferred Resources with very high grades of copper (approx. 4.5%) and good grades of zinc (approx. 5%), plus gold, silver and lead credits. The study, which assumed underground mining, arrived at a net present value at a discount rate of 8% (“NPV8”) of US$533 million and an internal rate of return (“IRR) of 26%.
One year later a PEA study was completed assuming open pit mining and an expanded throughput rate, halving the life of mine (“LOM”) from 25 years to 12 years. This did not improve the economics compared to the previous PEA: an NPV8 of US$537 million and 17.9% IRR. In addition, discussions were entered into with the Alaskan authorities towards advancing the Ambler Mining District Industrial Access Road (“AMDIAR”) to give better access to the UKMP projects.
Since then the Arctic project advanced slowly towards completion of a PFS, probably because of the low prevailing base metal prices. The company has consistently underspent the expenditure guidance given at the start of each year. The acquisition in June 2015 of Sunward Resources Limited (“Sunward”), the owner of the Titiribi deposit 70 km southwest of Medellin, Colombia, was an all-paper transaction, which brought in US$19.4 million in cash into the company’s coffers. Trilogy also received 5 million GOLD shares for the sale of Titribi, which resulted in adding C$7.6 million in cash to the treasury.
Fieldwork in 2014 continued at the Bornite project and an updated NI 43-101 compliant resource estimate was announced with 14.1 million tonnes Indicated Mineral Resources at 1.08% Cu and 109.6 million tonnes Inferred Mineral Resources at 0.94% Cu; a clearly much larger deposit than the Arctic project, albeit at much lower grade. The Management Discussion and Analysis (“MDA”) for the year ending November 2014 indicated that Trilogy aimed at advancing Arctic to “feasibility over a two to three year period for a total investment of approx. US$20 million”. Of the amount US$8-10 million was to be spent in 2015 to upgrading Inferred Resources to a higher level of confidence, with the balance for environmental and engineering studies.
The MDA one year later revealed that only US$4.2 million had actually been spent at the UKMP projects, of which only US$0.7 million on drilling with the promise that US$5.5 million would be spent on drilling in 2016, mostly at Arctic.
Early in 2016 an updated NI 43-101 resource statement for Bornite was released now with 40.5 Mt at 1.02% Cu in the Indicated category, and 141.9 Mt Inferred resources of which 57.8 Mt are defined as underground resources with an average grade of 2.89% Cu. Again expenses of drilling fell far short of what was promised a year before with only US$0.7 million allocated to this item from the total US$5 million expended at UKMP.
Progress in advancing AMDIAR has been also very slow with the Environmental Impact Study (“EIS”) only authorised by Alaska’s Governor in October 2015 and a project kick-off meeting held in early December 2016 (more than one year later!). The latest news is more promising with the draft EIS now scheduled for release for public comment by the end of March 2019.
In September 2016 the company’s name was changed to Trilogy Metals Incorporated to “better reflect our Company’s naturally diversified resource base”.
On 10 April 2017 Trilogy announced that it had granted South32 Limited (“South32”), a large diversified base metal company (market cap of US$12 billion), an option to form a 50/50 joint venture with respect to Trilogy’s UKMP assets and the Exploration and Option to Lease Agreement with NANA Regional Corporation, Inc. (“NANA”). To keep the option agreement valid South32 must contribute a minimum of US$10 million each year, for a maximum of 3 years. During these years South32 may exercise its option at any time to form the 50/50 joint venture. To subscribe for 50% of the JV, South32 will contribute a minimum of $150 million, plus any amounts Trilogy spends at the Arctic Project over the next three years to a maximum of US$5 million per year, less an amount of the Initial Funding (the US$10 million annual funding) contributed by South32.
In mid December 2017, with a major shareholder wishing to dispose of its shares, South32 acquired approx. 6.5 million shares (6% of the outstanding shares) and Rick Van Nieuwenhuyse, Trilogy’s CEO increasing his shareholdings by approx. 1.7 million shares to 2.8 million shares, or approximately 2.6%. Concurrently, Trilogy awarded South32 participation rights in future financings to participate at a minimum of 20% to a maximum of 40% in future financings, private or public, to a maximum ownership of 19.9% in the Company. This right expires if South32 does not participate for the lesser of 20%, or that number of shares that would not put them past a 19.9% ownership interest in the Company, in any particular financing.
The above paragraph can be seen as a great endorsement of South32 (and the CEO in his personal capacity) of the prospects for the UKMP assets.
On 20 February 2018 the company announced the results of the PFS for the Arctic project, assumed to be developed as an open pit operation, with an after-tax NPV8 of US$1,413 million and IRR of 33.4%. This report was filed on the Sedar website and constitutes the basis for the updated valuation.
Figure 3_1 shows the share price performance of Trilogy since April 2012 on the Toronto stock exchange compared to the copper price over that period.
It is not clear what caused the sharp drop in share price immediately following listing, but this could be related to large Novagold shareholders disposing of the share as the base metal nature may not have been in line with a precious metal focused investment strategy. Since then the share price has roughly followed the fortunes of the copper price until the beginning of 2018 when it started to rise despite a sharp drop in the copper price. On 14 December 2018 the price dropped 12% following a bad market day and average infill drill results for Bornite.
Since the 2017 valuation, which concluded that “Trilogy seems therefore a terrific investment opportunity”, the share price has more than tripled.
4. Historical Performance
Table 4_1 gives the historical financial performance from 1 December 2010 (financial year-ends are on 30 November) until 31 August 2018 for Trilogy.
Table 4_1 shows that:
- Trilogy almost fully expensed its exploration work.
- Outlays were high until 2013 with the numbers in the 2011 financial year reflecting activities funded by Novagold’s. In 2012 the financing was fully provided by Novagold.
- After 30 November 2013 Trilogy’s management reduced its annual expenses to a remarkable constant ± US$8.6 million, only to increase expenditure with improving metal prices and the involvement of South32.
- The remarkable feature of historical financial performance is that it required very little shareholder support by first drawing down the cash balance and then acquiring cash through an all paper transaction in 2015 (see yellow highlighted cell), followed by South32 funding, which is accounted for under “Investment”.
- Given the US$24 million acquisition in 2009 by Novagold and the total spent of US$100.3 million since November 2010 total investments in the projects are probably approximately US$125 million.
The table illustrates that management hardly called upon its shareholders for funding. It has spent US$100 million and needed to tap shareholders for only US$36 million, most of which occurred in 2018 for US$28.8 million. One of the reasons for this is management being very modest with their own remuneration. In the nine months to 31 August 2018 they spent US$2.9 million on salaries, general and administrative expenses and investor relations. In addition US$0.4 million were spent on professional fees on an annualised basis. Stock-based compensation was more generous at US$1.3 million. One can conclude that money spent is really for advancing projects, slowly in the years before South32’s involvement, much more rapidly since.
The following section will look into what past expenditure has achieved for the current shareholders in terms of project value.
5. Valuation of the Arctic Project
5.1 Background
The technical information, illustrations and wording in Section 6.1 to Section 6.6.8 of this report have been drawn from a NI. 43-101 compliant technical report in support of the PFS, dated 6 April 2018 by Ausenco Engineering Canada Incorporated (“Ausenco”) unless specifically stated otherwise.
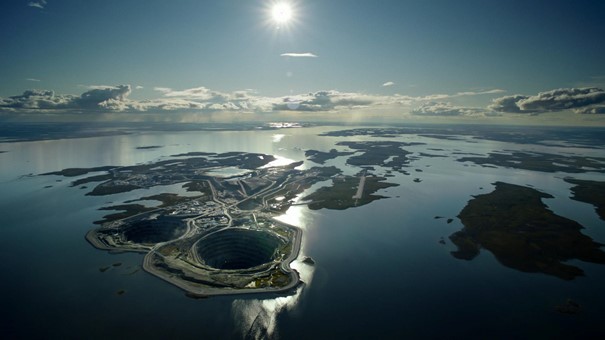
The Arctic Project is located in the Ambler District of the southern Brooks Range, in the Northwest Arctic Borough (“NWAB”) of Alaska, 270 km east of the town of Kotzebue, 36 km northeast of the village of Kobuk and 260 km west of the Dalton Highway (see Figure 5.1_1).
The project area is geographically isolated with no current road access, or nearby power infrastructure.
The Ambler State Mining Claims in which the Artic project is situated consists of 1,358 contiguous claims, covering a total area of 45,348 hectares (“ha”) (see Figure 5.1_2).
The map also shows the exploration area secured from NANA in which the Bornite project is situated at 17 km southwest of the Arctic deposit. Trilogy and NANA have entered into an agreement (“the NANA Agreement”) that consolidates Trilogy’s and NANA’s land holdings into an approximately 142,831 ha land package. In return for access to all of the NANA lands for mineral development such as roads and mine facilities (e.g. plant, waste dumps, tailings dams), NANA will the right to elect within 120 days after project go-ahead decision to either:
- Exercise a non-transferrable back-in right to acquire between 16% and 25% (as elected by NANA). The cost to exercise such back-in-right is payable in cash and equal to the percentage interest in the Arctic Project multiplied by the difference between (i) all costs incurred by NovaCopper or its affiliates on the project, including historical costs incurred prior to the date of the NANA Agreement together with interest on the historical costs; and (ii) $40 million.
- Not exercise its back-in-right, and instead receive a net proceeds royalty equal to 15% of the net proceeds after Trilogy/the JV company with South32 have earned a return of 9% on the total investment. The net proceeds royalty is deductible as expenses.
Kennecott has retained a net smelter return (“NSR”) royalty of 1% that is purchasable at any time for a one-time payment of US$10 million. This royalty is now owned by Osisko Gold Royalties Limited (“Osisko”). In addition in return for entering rights and surface use rights NANA is entitled to a 1% NSR on production from the Ambler State Mining Claim area.
5.2 Geology and Mineralisation
The mineralisation at the Arctic Deposit and at several other known occurrences within the Ambler District consists of polymetallic (zinc-copper-lead-silver-gold) volcanogenic massive sulphide (“VMS”) like occurrences. VMS deposits are formed by and associated with sub-marine volcanic-related hydrothermal events. These events are related to spreading centres such as fore arc, back arc or mid-ocean ridges.
The mineralisation occurs in the Ambler Sequence schists over a strike length of approximately 110 km (see the red outline in Figure 5.2_1).
The deposits are hosted in volcaniclastic, siliciclastic and calcareous meta-sedimentary rocks interlayered with mafic and felsic meta-volcanic rocks. Sulphide mineralisation occurs above the mafic metavolcanic rocks, but below a schist that is a distinctive district wide felsic unit characterised by large albite porphyroblasts after relic phenocrysts.
The map above and the following paragraph give the impression of simple geology, but Figure 5.2_2 with the geological map over the Arctic deposit shows that this is far from the truth.
The map shows thrust faulting (indicated by line with teeth signs in the direction of the overthrusted block) and open to isoclinal fold structures (arrow signs for dip direction of bedding). Only vaguely distinguishable on the map are the red interrupted lines, where the massive sulphide horizons outcrop at surface. The area within the interrupted red line indicates the area within which the resources are defined.
Mineralisation occurs as stratiform semi-massive sulphide to massive sulphide beds within primarily graphitic chlorite schist and fine-grained quartz sandstone. The sulphide beds average 4 m in thickness, but vary from less than 1 m up to as much as 18 m in thickness. The bulk of the mineralisation is within five zones lying along the upper and lower limbs of the Arctic isoclinal anticline. All of the zones are within an area of roughly 1 km2 with mineralisation extending to a depth of approximately 250 m below the surface.
Figure 5.2_3 shows a cross section through the Arctic geological model looking north showing the massive and semi massive sulphide horizons (in red) approaching each other towards the west where the fold closure is interpreted to be.
Geological modelling focused on the distribution of mineralisation (massive and semi massive sulphide), specific gravity and litho-geochemical models. Geometrically, the mineralisation is confined to six lenticular mineralised zones concentrated along an isoclinal fold hinge. Five of the six semi massive zones contain a core of massive sulphide material.
Mineralisation is predominately coarse-grained sulphides consisting mainly of chalcopyrite (CuFeS2), sphalerite (ZnS), galena (PbS), tetrahedrite (Cu,Fe)12Sb4S13, arsenopyrite (FeAsS), pyrite (FeS2) and pyrrhotite (approx. FeS).
5.3 Mineral Resources and Reserves
5.3.1 Resource Estimation
Figure 5.3.1_1 is a map showing the collar locations and traces of the 152 drill holes within the immediate vicinity of the Arctic deposits that have been used for the resource estimation. The number of holes used is only 17 more than for the 2013 mineral resource information. It should be noted that the spacing is rather large, varying from 75 m to 100 m, with exact collar locations depending on what the steep, rugged terrain allowed.
For the 2017 resource estimation Trilogy supplied a subcontractor of Ausenco responsible for the resource estimation, SIM Geological Incorporated (“SIM”), with the wireframes of the surface topography and geology.
The technical report on the PEA on open pit mining, carried out by Tetra Tech in July 2013, includes information on the volume and average thicknesses of the six mineralised zones, referred to in the second last paragraph in Section 5.2. These are reproduced in Table 5.3.1_1 to illustrate the relative importance of three of the six domains. Unfortunately, the PFS report does not contain a similar table.
The table shows that, of the five domains, two are negligible in terms of volume and also have the narrowest thicknesses. Of the total mineralisation volume approx. 70% is massive sulphide.
Contact profiles of grade distribution have shown that there is a very abrupt change in assay values at the contact, which technically is referred to as “hard boundaries”, important to defined how assay values are included for block grade estimation. During estimation, all of the estimation domains, including massive and semi-massive transitions, were treated as hard boundaries, preventing the sharing of composites across boundaries.
Similar to the 2013 resource estimation, a block size of 10 m x 10 m x 5 m was used, but with sub blocks of 4 m x 4 m x 2 m to better capture the mineralised blocks. Copper, zinc, lead, gold and silver grades were estimated using ordinary kriging (“OK”) methodology and, for blocks within the mineralised zone domains, specific gravity. Block model grades for the mineralised material portion of the block were calculated based on the proportion of massive sulphide and semi massive sulphide within each block.
Very high grades have not been capped, but beyond a certain threshold defined for each metal and for each domain, their spatial influence limited to 40 m (with hole spacing usually 75 m).
Whereas much was made in the 2013 resource estimation of the orientation of the plane of greatest continuity (the flattening plane of the mineralised zones, variograms and search ellipsoid) used to interpolate grades of drill intercepts for block grade estimation, the 2017 estimation is quiet on that.
Table 5.3.1_2 compares the input parameters used to generate a resource limiting pit shell for the 2017 resource estimation with those for the 2013 resource estimation.
The table illustrates that metal prices and operating cost assumptions are very similar. The 2013 used a NSR cut-off grade, whereas the 2017 used a Cu-Eq grade as cut-off grade, which was determined by the following relationship:
Cu Eq grade (%) = 0.92 x Cu grade (%) + 0.29 x Zn grade (%)+ 0.231 x Pb grade (%) + 0.398 x Au grade (g/t) + 0.005 X Ag grade (g/t).
The derivation of the above relationship is not provided. The cash flow model shows that after accounting for payability and off-mine charges the factors should have been 1.00 for in-situ Cu-grade, 0.30 x Zn-grade (in %), 0.13 x Pb-grade (in %), 0.54 x Au-grade (in g/t) and 0.008 x Ag grade (in g/t).
Table 5.3.1_3 compares the resource estimation of 2017 with the resources declared in 2013 on an undiluted basis. Much in the 2013 estimation was made of “internal block dilution” resulting from waste included in a block size of 10 m x 10 m x 5 m. The latest resource estimation is totally quiet on this and reports only undiluted resources. To compare apples with apples, the grades of both estimates are shown “undiluted” in Table 5.3.1_3.
The table shows that the 2017 estimate has 45% more tonnes in resources, which can to a minor extent be explained by the lower grade because of a lower cut-off grade resulting more favourable input parameters. According to Trilogy management the increase in total resources is explained by much wider than previously interpreted widths of the massive sulphide intersected by the infill holes and different geological interpretations that have added previously excluded material. For such a major change, a proper explanation and reconciliation in the PFS report was warranted.
Figures 5.3.1_2 shows two cross sections through the grade block models to illustrate the distribution of respectively the copper grades in the various zones.
The PEA technical report of 2013 showed similar sections, also for the lead, zinc, gold and silver, Illustrating an excellent correlation between the block grades of the five elements, which is economically favourable for mining purposes.
For a better understanding of the deposit in plan, reference has been made to the 2012 PEA, which provides a level plan of the block model. Figure 5.3.1_3 shows at the top the level plan at 720 m elevation through the block model with copper grades illustrating the tight fold closure in the west and with the fold structure again folded with the gentle synform hinge zone in the northeast.
5.3.2 Mineral Reserves
The pit optimisation parameters for the reserve pit shell are based on slightly more conservative values than for the resource pit shell as shown in Table 5.3.2_1.
For the reserves estimation dilution was applied to the undiluted resources in two steps:
- Planned dilution, including waste that is included in the 5 m x 5 m x 2.5 m smallest mining unit (“SMU”). The small size SMU assumes mining equipment that can be highly selective in what is broken and loaded.
- Contact dilution: assumes that the grade of a given SMU block will be diluted “by 20% of tonnage from each of the four adjacent blocks”. This does not make much sense as stated as it implies that the particular SMU would have 80% material from adjacent blocks. If an adjacent block is classified as Inferred Mineral Resource, its grade is considered to be zero. If the adjacent block is classified as Indicated, but below cut-off, dilution is taken at the grade of the adjacent block.
Table 5.3.2_2 gives the mineral reserve statement as declared by Ausenco.
The table shows that Indicated resources are diluted by between 22% and 25%. The explanation for the reserve tonnage being less than an extra 20%, instead of increased equal to the dilution rate is due to mine losses incurred.
Compared to the mineable inventory of the 2013 PEA, the grades of the base metals are slightly higher and of the precious metals slightly lower.
Required to access the ore reserves is the removal of 296.4 million tonnes of waste for a strip ratio of 6.9, which is very much lower than the 8.4 strip ratio assumed in the PEA study. Whereas the PFS technical report does not give any reconciliation or explanation for this variance, Trilogy management has for this report explained the drop in the strip ratio being the result of the choice of a conservative pit design that is clearly smaller than the maximum NPV pit shell. This dropped out 4 million tonnes mineralisation, which has 79 million tonnes waste associated with it (i.e. a strip ratio of almost 20).
5.4 Mining Operations
The discussion of mining operations is to the same level of detail as that in the PEA study, which is somewhat surprising.
The mine is designed as a conventional truck-shovel operation assuming a combination of 5 m and 10 m benches, the smaller height presumable for ore blasting. The smaller bench height is contradicted in tables in the PFS report that give a bench height of 10 m for ore as well. Even the smaller quoted bench height is still double the height of the SMU of 2.5 m.
Equipment selection includes 131 tonne trucks for waste and 91 tonne trucks for ore, as well as 17 m3 and 12 m3 shovels for waste and ore respectively. For an SMU of 5 m x 5 m x 2.5 m the shovel size for ore is very large, putting a question behind the reasonableness of the assumptions for applicable dilution.
The pit design includes three nested phases to balance stripping requirements while satisfying the concentrator requirements.
Whereas the PEA production schedule provided for a ramp-up period of almost four years before achieving full mill capacity of 10,000 tonnes per day (“tpd”), equivalent to 3.65 Mt per annum, the PFS study assumes that this rate is achieved during the first year of production after two year of pre-production waste stripping and limited ore mining and stockpiling. The mine design assumes a minimum mining width of between 70 m and 100 m to accommodate the equipment, considerably wider than the 40 m assumed in the PEA.
Much was made in the PEA study about the large proportion (estimated to comprise 70%) potentially acid generating (“PAG”) waste in the material that needs stripping, which would require special disposal in the tailings dam to prevent acid leaking into the environment. In the PFS study they have simplified the approach to handling PAG by no longer handling it separately from non-acid generating (“NAG”) waste, but dumping it all in a single waste rock dam (“WRD”) facility downstream from where the tailings dam facility (“TDF”) is planned.
According to Trilogy management, the reason for the simplified approach follows studies showing very slow leach kinetics at the temperatures prevailing at the Arctic project area and control of any seepage from the tailings dam through collection and used in the process plant, or treated before release.
The portion bordering the tailings dam will be compacted to further support the dam wall of the TDF. To cope with any acid water drain and dissolved metals a rockfill underdrain will be constructed in the current valley channel bed. The underdrain will be excavated into the overburden prior to waste dump construction and will be capable of handling base flow through the Sub-Arctic Creek valley. Water will be collected in a pond at the base of the WRD and held for treatment.
The tailings dam itself and upstream face of the dam will be lined with a single side textured 60 mm HDPE geomembrame, placed over 1 m of bedding material. The bedding material will protect the liner against puncture from potential sharp clasts in the overburden and exposed bedrock within the impoundment footprint. It is not explained in the PFS report why the base of the TDF needs to be lined to prevent acid and dissolved metals to drain into the ground below and the waste rock dump area not. This is a question that may well arise during the environmental permitting process.
Figure 5.4_1 shows the planned location of the plant, waste dump and tailings dam relative to the pit with the primary crusher approx. 1 km away from the pit exit point.
5.5 Metallurgy and Processing Operations
5.5.1 Metallurgical Testwork Results
At the time of the first PEA in 2012 it was recognised that much testwork remained to be done to clarify the flotation process to generate relatively clean concentrates at acceptable recoveries. Comminution tests had shown the material to be relatively soft (ball work index between 6 kWh/t and 12 kWh/t) and non-abrasive, both factors being conducive to low processing cost.
In 2012 bench scale and locked cycle tests were carried out to resolve flotation issues. The tests envisaged production first of a bulk copper-lead concentrate and zinc concentrate, followed by separation of copper and lead from the bulk concentrate. Adequate liberation of the main ore minerals was achieved at a grind size of 80% passing (“P80”) 70 μm.
In general the tests produced similar metallurgical responses, but with slight differences in performance between mineralised zones. It should be noted that the PEA report mentions that the samples were “low talc mineralized composite”. The results may therefore be interpreted as possibly not representative.
The cleaner flotation tests showed that regrinding was required to upgrade the bulk concentrates prior to separation of copper and lead minerals. Concentrate regrinding was therefore incorporated into all locked cycle tests and open circuit cleaning tests. The target regrind sizes were P80 24 μm for the copper-lead bulk concentrate and P80 40 μm for the zinc concentrate.
Flotation test work conducted in 2017 was focused on predicting the expected performance of the proposed copper and lead separation process, which required the use of larger test samples. A pilot plant was operated to generate approximately 50 kilograms of copper and lead concentrate, which became test sample material in locked cycle testing of the copper and lead separation process.
The lead concentrate produced from the locked cycle work contained only about 24% lead, due to contamination of the concentrate with talc minerals, much lower than the 41%-59% in previous test work on low talc samples. According to Trilogy management, 2017 testwork showed that inclusion of additional talc flotation capacity will resolve this.
Table 5.5.1_1 compares the predicted metallurgical performance suggested in the Section 13 of the PFS report (Mineral Processing and Metallurgical Testing) and used in the cash flow model and the same for the 2013 PEA.
The metal recoveries in the PEA are modelled as function of the grade in the mill feed, whereas the recoveries in the PFS are assumed constant, irrespective of feed grade. The table shows some remarkable differences in performance between the PEA and PFS studies, the most important of which is recovery of precious metals into lead concentrate instead of copper concentrate. According to Trilogy management the smelter terms are much better for these metals in lead concentrate than copper concentrate and the testwork in 2017 was specifically carried out to achieve concentration in lead concentrate.
The inconsistencies between the text and modelled metallurgical performance in the PFS are highlighted yellow in the table. These show a further improvement for the metallurgical performance, in particular for the quality of the concentrate, thereby improving payability and reducing off-mine costs. It is unsatisfactory that the PFS does not provide any arguments for these improvements, and this valuation has ignored it using the performance suggested in the text of the report.
For both PEA and PFS the average copper recovery is above 87% into a Cu-concentrate with a very high copper content, considering that the theoretical copper content of chalcopyrite is 34.6% Cu. This implies that the copper concentrate can be very effectively cleaned of other sulphide minerals. Almost all of the gold is captured in the Pb-concentrate whereas the silver reports to the Cu- and Pb-concentrates. The recovery of zinc is good into a Zn-concentrate with a very good zinc-content.
The analyses of the concentrates indicate a possibility for penalties relating to the Pb, As, Sb and Hg contents in the Cu-concentrate, penalties for As and Sb contents in the Pb-concentrate and for Cd in the Zn-concentrate.
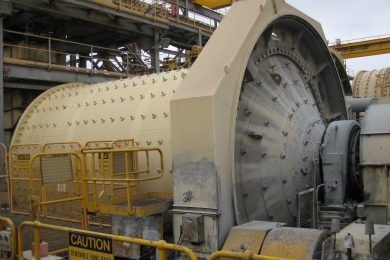
5.5.2 Selected Process Flow
The suggested process route includes primary crushing to a particle size of 80% passing (“P80”) 125 mm, followed by two stages of grinding, consisting of one SAG mill and one ball mill in closed circuit with hydrocyclones. The hydrocyclone overflow with a grind size of approximately P80 70 μm will first undergo pre-talc flotation, and then be processed by conventional bulk flotation to recover copper, lead and associated gold and silver, followed by zinc flotation. The rougher bulk concentrate will be reground to P80 35-40 μm, subjected to cleaner flotation, followed by copper and lead separation to produce a lead concentrate and a copper concentrate. The final tailings from the zinc flotation circuit will be pumped to the tailings disposal facility. Copper, lead, and zinc concentrates will be thickened and pressure filtered to reduce the moisture content to approx. 9% before transportation.
It should be noted that the massive sulphide nature of the mineralisation could make it amenable to pre-sorting, because of the distinct difference with the host rocks and sharp contacts between mineralisation and host rock. In 2017 Trilogy commissioned a study to determine this and whether it should be included in the process flow sheet of the feasibility study. Results were originally expected in “the spring of 2018”, but initial results were only received in May 2018. Now a final decision is expected at the end of 2018.
5.6 Economic Valuation – Arctic Project
5.6.1 Introduction
For this valuation the input parameters as suggested by the PFS have been modelled, also to verify that the taxes have been modelled accurately. Thereafter input parameters have been amended, or flexed to determine their impact on the cash flow.
5.6.2 Metal Prices and Marketing Terms Assumed
This valuation has modelled For the Base Case of this valuation, the spot prices on 14 December 2018, US$1,239/oz Au, US$14.55/oz Ag, US$2.78/lb Cu and US$1.18/lb Zn and US$0.88/lb Pb and exchange rate of C$1.338 per US Dollar were used to determine the value of the discounted cash flow.
Table 5.6.2_1 shows the marketing terms for the various products assumed by Ausenco in the derivation of LOM at-mine revenue. For simplicity sake, the possibility of penalties was ignored in this valuation.
The above terms are reasonable especially compared to current market conditions with much lower than assumed treatment charges for lead and zinc.
Ausenco erroneously assumed that with the very good quality concentrates, the minimum deductions never come into play and the maximum payabilities have been used for all metals. This is wrong for the effective payability for silver in copper concentrate (85.5% versus 90%).
Table 5.6.2_2 explores the LOM at-mine revenue for this valuation and the PFS cash flow model and the contribution of the concentrates and metals to revenue. This valuation has ignored the drastically improved concentrates qualities as being not sufficiently substantiated. This could be overly conservative.
The table illustrates that for the PFS the copper concentrate accounts for more than 63% of total revenue and copper metal is responsible for slightly more than 60%. Zinc adds another 21% to revenue. The Arctic project is therefore dominantly a copper-zinc project. The contribution of lead is negligible, but recovery of the metal is necessary to clean the copper concentrate and to capture the precious metals as by-products. The precious metal content is the reason for the lead concentrate being the highest value product. The high off-mine costs for zinc result in only 51.9% of the value of the metal produced being paid for.
Using the metallurgical recoveries, concentrate grades and metal prices used in this valuation, results in a 6% drop in at-mine revenue of US$438 million, of which US$260 million is accounted for by using the metallurgical performance suggested in the text of the PFS report and not the cash flow model’s assumptions.
5.6.3 Production Schedule
This valuation has adopted the production schedule in the feasibility study, which includes a three-year pre-production period, a first year of production at 85% of steady state plant throughput of 3.65 million tonnes per annum (“Mtpa”), followed by ten year steady state production and treatment of the remaining reserves in year 12.
Although the feed grades vary over the years, there is no clear high grading period, or trend to these grades. The PEA had modelled the metallurgical recoveries as a function of feed grades, but the PFS assumes constant recoveries, irrespective of grade fluctuations.
The PFS cash flow model calculates the financial performance as if the go-ahead decision has been made. This valuation assumes that the three-year preproduction starts on 1 January 2020 with first construction activities during the year. This may be too optimistic and an additional 1-2 years required for studies and permitting.
One can argue that the discount rate for the years before go-ahead decision should be lower than the 7.5%-8% appropriate for discounting project net free cash flow, because the shareholders’ required rate of return should in that period be equal to what they can get in the general market. For this reason, the project NPV’s established at the start of 2020 have been discounted by an additional 5%
5.6.4 Operating Expenditure
Table 5.6.4_1 shows the cost structure suggested in the PFS study compared to the 2013 PEA study, where possible giving the same breakdown as used in the PEA.
Immediately apparent is the generally much lower numbers than for the PEA. The explanation for the lower unit mining cost could be the much higher oil price in 2012 (i.e. US$86.5/barrel, or US$92.2/barrel inflation adjusted) than prevailing at the PFS publication date. The PEA study states the assumed fuel price as US$1.182/l, but the PFS gives no details for consumable prices used.
The much lower processing cost is purely because of much lower power and consumables/spares provisions. The lower power cost is due to much lower electrical power unit cost generated on site of US$0.173/kWh generated with liquefied natural gas (“LNG”), compared to US$0.322/kWh in the PEA, generated with diesel. According to the PFS the LNG will be supplied “via existing fuel supply networks near Port Mackenzie, Alaska.”
The phrasing is somewhat misleading as Trilogy actually assumes the implementation of the massive (US$43 billion) Alaska LNG Project (however, production planned for overseas exports), alternatively the completion of expansion of the LNG facility at Fairbanks, which if approved, financed and constructed would have more production by 2020. At the time of the PFS publication date the Pentex Alaska Natural Gas Company (“Pentex”) was owned by the Alaska Industrial Development and Export Authority (“AIDEA”), the same agency is responsible for the access road construction, and which was according to Trilogy “eager to finance expansion of the plant”. Pentex was however sold in June 2018 to the Internal Gas Utility (“IGU”), which is a public corporation with has a its mission “to provide low cost, clean burning, natural gas to the largest number of customers in the Fairbanks North Star Borough (“FNSB”) as possible, as soon as possible”. With that AIDEA has lost much control over promoting the project.
It is from the above clear that it is imprudent to hang an input for a feasibility study on something that is still uncertain.
General and Administration expenses in the PFS are considerably lower than for the PEA, attributable to lower camp cost and especially crew transportation cost. It would have been good if the PFS report had given a reconciliation with the PEA provisions showing the reasons for the large downward revision.
The PFS estimation of site services costs are also much lower than in the PEA, partially because a number of services such as road, airstrip and building maintenance and avalanche control have dropped out. The main reason is however, much lower staffing and water treatment costs.
Access to the Arctic Project is proposed to be via a road, referred to as Ambler Mining District Industrial Access Project (“AMDIAP”) approximately 340 km long, extending west from the Dalton Highway where it would connect with the proposed Arctic Project area. The plan is for AIDEA, a state-owned private company, to raise the finances and construct the road and recover its investment through a toll levy. The PEA study assumed that the toll would be based on a US$150 million 30-year bond at 5% interest rate, with the Arctic Project paying US$9.7 million each year for its 12 year LOM. In the PFS this has increased to US$300 million and a 6% and 15-year facility. Yet, the toll was assumed still US$9.7 million annually for 12 years. No explanation is given why the annual toll has not increased. The PFS has however also included a road maintenance fee of US$2/tonne treated.
When benchmarking the suggested operating costs against the open pit Red Dog mine in Alaska, the unit costs compare very low, less so the mining cost. A NI 43-101 technical report by Teck dated 21 February 2017 gives mining cost of US$3.00/t mined for waste and US$3.15/t for ore with milling costs of US$29.11/t, Indirect cost (defined as overhead for mining and milling, camp and personnel transport costs) of US$7.011/t and G&A cost (defined as overheads for other service departments) of US$17.66/t. The mining unit rate of Teck therefore excludes technical services and supervisory costs, which seem to be assumed included in the Trilogy rate. Moreover, applying the rates for annual Indirect and G&A expenses to the current mill rate of 4.18 Mtpa, more than US$100 million is spent on these items alone each year.
Because of the unsatisfactory motivation for the various operating cost estimate reductions, this valuation has added a 20% adjustment to increase the unit operating cost to US$55.73/t.
In addition, annual corporate overheads of US$5.6 million per annum were included.
5.6.5 Capital Expenditure
Table 5.6.5_1 shows the capital cost estimates suggested for the PFS compared to the provisions in the 2013 PEA study.
The information provided in the PFS is impossible to reconcile to the PEA values and the breakdown is very awkward, partially for “major facility” (as in the table) and for “major discipline” with by far the largest item “Third Party Estimates” (US$328 million).
The table shows a general decline in LOM capital expenditure with higher initial capital expenditure more than compensated for by lower sustaining capital expenditure. This is mainly due to very large savings on the tailings dam and a change in approach to waste handling, now assumed stored in a much cheaper, combined facility. There is nothing that stands out as very much underestimated, but it is difficult to determine what the total plant cost is including construction indirects, EPCM, etc. One would expect that the total plant in a difficult and isolated location such as Arctic with a monthly capacity of 3.65 Mtpa would cost more than US$210 million. Owner’s cost of slightly more than US$7 million per annum looks very low for a project such as Arctic.
The above totals exclude closure and rehabilitation cost, which the 2013 PEA estimated at US$81.6 million. The PFS estimates total closure cost of US$30.3 million with post closure monitoring and water treatment cost of US$295 million. However, the PFS discounts the annual outlays over 200 years by a rate of 4.3% resulting in a post closure NPV of US$35,05 million for a total closure rehabilitation estimate of US$65.3 million. This must be seen as very optimistic. The amount set aside for post closure expenses will have to be invested in a low risk vehicle, which will not give a 4.3% real return. As this long-term issue will not affect the valuation of Trilogy in the short to medium term, the post closure under estimation has been ignored as immaterial.
This valuation has adopted the provisions and will investigate through sensitivity analysis the effect of higher capital expenditure.
5.6.6 Working Capital
Mining operations that produce a concentrate as important saleable product have to make a considerable investment in working capital. Table 5.6.6_1 shows the assumptions used for quantifying the investment in net current assets based on the metal prices and assumptions in the PFS and this valuation.
Applied to the PFS inputs, the maximum investment in net current assets peaks at US$70.6 million, but this is completely ignored in the study. When using the input parameters of this valuation the peak investment is US$7.7 million higher.
The net current assets remaining at the end of the LOM have been assumed fully recovered, ignoring the risks of obsolesce, degradation and realisation costs.
It should be noted that the above total provisions are probably optimistically low for the type of operation Arctic will be.
5.6.7 Royalties and Taxes
There are two royalties of 1% NSR applicable, one for the benefit of NANA and the other a retained interest by Rio Tinto now owned by Osisko Royalties. The latter is subject to a buy-out at any time of US$10 million. This valuation has assumed exercising the buy-out at the start of year 1. The PFS seems to ignore this outlay.
USA taxation is notoriously complex and the explanations in the PEA and PFS leave much open. The text of the PFS report gives a one-and half page explanation of the latest tax regulations assumes, which glosses over for a cash outflow item that is the third largest after off-mine charges and operating cost.
For this reason this valuation has also referred to a 2012 slide presentation by PWC at the American School of Mines entitled Basics of U.S. Mining Taxation and a note by PWC with the title Corporate Income Taxes, Mining Royalties and Other Mining Taxes; A Summary of Rates and Rules in Selected Countries, dated June 2012.
Applicable taxes for mining companies in Alaska are:
- As from 1 January 2018 Federal Income Tax at 21.0%, which is a great reduction from the 35% applicable at the report date of the PEA.
- Alaskan State Tax another (“AST”) 9.4%.
- Alaskan Mining License Tax (“AMLT”) – 7.0%
The tax base for Federal Income Tax is calculated as revenue less allowable costs (presumably operating costs), AST, depreciation and the greater of cost depletion or percentage depletion. According to the PWC note on rates, a depreciation rate of 14.3% is applicable on mining investments. This has been applied to sustainable capital expenditure.
The calculation of the depletion allowance is a typical example of the overly complex US tax system.
- The greater of cost depletion and percentage depletion is allowed with:
- For Cost Depletion there are three different methods, but this valuation has ignored two and used the simplest of all writing down the pre-production capital investment at 10% per annum.
- Percentage Depletion is the lower of a specified percentage of net metal revenue (revenue minus royalties) and 50% of net taxable income before depletion. The “specified percentages” for gold, silver and copper is 15% and 22% for lead and zinc.
From the documentation it seems that Percentage Depletion can be deducted annually also after recoupment of the initial capital expenditure.
Losses in a given year may be carried back two years and carried forward for 20 years, except losses incurred as a result of the reclamation costs, which may be carried back 10 years.
AST is determined on the same basis as Federal Tax and the Alaska AMT ignored as not applicable.
AMLT is determined on the same basis as AST, except that the percentage depletion is the lower of 15% of net metal value and 50% of net income before depletion. Mining operations are exempt of this tax for the first 3½ years of their life of mine.
The 2013 PEA assumed that no allowed investment or cumulative loss balances exist before initial capital expenditure starts. This valuation has adopted the same approach, but records that theoretically approx. US$115 million should be available (see Section 2) and has assumed spending of another US$15 million before project go-ahead, financed from current cash balances.
The previous valuation tested the model by comparing the taxes calculated over the LOM of the open pit scenario using the same input parameters as the base case of the PFS are US$1,224 million for an effective tax rate of 22.5%, which is 5.4% higher than the quoted overall tax burden in the PFS of US$1,162 million, probably because of tax allowances used that have not bee specified. Obviously this valuation’s tax model introduces a slight negative bias into the results.
This valuation has taken account of the tax cuts recently introduced in the USA.
5.6.8 NANA’s Beneficial Interest
In Section 3.1 the back-in right of NANA upon announcement of project go-ahead was discussed. Whereas NANA may well elect to purchase a 25% interest by paying the 25% of moneys invested minus US$40 million, it has been assumed here that they will elect for a 15% free carried net profit interest (“NPI”). According to the CEO of Trilogy, participation in net profits kicks-in after Trilogy/JV Company has earned a 9% return on its investments. The NPI is fully deductible for tax purposes. To avoid circular references in the cash flow model, this valuation has calculated the NPI on an after-tax basis, which should have little overall impact on the return to Trilogy/JV company.
5.6.9 Results
Table 5.6.9_1 compares the financial performance as per PFS with that for this valuation.
The net effect of the changes to the input parameters, being longer lead time, more plant feed, lower metallurgical recoveries and less favourable concentrate qualities, the buy-out of the Falconbridge/Rio Tinto royalty, 20% higher operating cost, the inclusion of investments in net current assets and more conservative tax calculation, is substantially lower cash flow for the Arctic project before having to give NANA its 15% share after earning a 9% return.
Under both scenarios the cash-operating margin is very high at between 64.2% and 71.5%. With an effective tax rate of 22%, much cash flows to the bottom line. The initial capital expenditure is less than 1.3 times annual at-mine revenue, which compares low to other mining projects. The pay-back period on an undiscounted basis is 2.8 years and the IRR is 18.1% assuming all funding to cover initial capital expenditure is arranged upfront and parked in risk-free financial instruments, which generate no real return.
The conclusion is that, at current metal prices, Arctic is a very robust project.
Under Section 5.6.5 it was already mentioned that the initial capital expenditure estimate is probably too low. Table 5.6.9_2 expresses the sensitivity of the project value as the change in Net Present Value per percentage point change in the economic main parameters.
As examples of how the table should be read, for every percentage point increase in copper and zinc prices the NPV8 increases by US$23.4 million (i.e. 2.9%) and for every percentage point increase in the LOM capital expenditure (i.e. US$8.5 million) the NPV8 drops by US$5.3 million (i.e. 0.7%). The small negative effect of operating cost and capital expenditure increases relative to the Base Case values again demonstrate the robust nature of the project.
6. Review of the Bornite Project
6.1 Background
Unless specifically otherwise stated, all information, illustrations and wording in Section 6.2 until Section 6.3 have been drawn from a NI.43-101 compliant technical report, dated 20 July 2018, by BD Resource Consulting incorporated (“BDRC”) and Sim Geological Incorporated (“SIM”) in support of an updated mineral resource estimate.
The location and tenure of the Bornite project were discussed in Section 5.1 of this report. Trilogy owns patented claims over the core of the drilled project area.
6.2 Geology and Mineralisation
The mineralisation at Bornite has been interpreted as occurring in intra-continental to continental margin settings, which have been subjected to extensional tectonics with basin-margin faults playing an important role in localising mineralisation.
The geologic model generated for the Bornite deposit consists primarily of a series of inter-bedded carbonate and phyllitic (=mica rich) rocks that dip gently to the north and overlay a quartz-phyllite footwall. Some of the phyllite and carbonate units are continuous across the whole deposit area and others pinch out and are more localised.
Copper and associated cobalt mineralisation primarily occurs as massive, semi-massive, stringer, veinlet and disseminated accumulations of copper minerals in dolomitised portions of the sedimentary host rocks.
Mineralisation at Bornite occurs as tabular zones that coalesce into crudely stratiform bodies. Two significant dolomitic horizons that host mineralisation have been mapped by drilling and include (see also Figure 6.2_1):
- the Lower Reef, a thick 100 m to 300 m thick dolomitised zone lying immediately above the basal quartz phyllite (QP) unit of the Anirak Schist; and
- the Upper Reef, a 100 m to 150 m thick dolomite horizon roughly 300 m higher in section.
The discussion about mineralisation at Bornite revolves around two areas: the Ruby Creek zone and South Reef, neither of which is clearly identified in the maps and illustrations of the technical report and there is no clear discussion how these relate to each other. As all four technical reports from 2014 to 2018 on the project are virtually identical, none on their own clarifies the relationship.
However, the cross section in Figure 6.2_1 for the Ruby Creek Zone was extracted from the 2014 technical report and shows in the bottom right the trace of the cross section. The cross section in Figure 6.2_2 has been extracted from the 2018 technical report and is for South Reef, again identified by a trace in the upper left corner.
From this can be concluded that the Ruby Zone is located in the west where the mineralisation is less deep, but also less thick according to the thickness contours of the maps with section trace. The South Zone is deeper and wider.
Figure 6.2_2 shows that copper mineralisation comprised of chalcopyrite, bornite, and chalcocite distributed is present in stacked, roughly stratiform zones exploiting favourable stratigraphy within the dolomitised limestone package. The distribution of copper mineral species is zoned around the bottom-centre of each zone, with bornite-chalcocite-chalcopyrite at the core and progressing outward to chalcopyrite-pyrite.
Bornite (Cu5FeS4) and chalcocite (Cu2S) are high Cu-content mineralised with theoretically up to respectively 63% Cu and 80% Cu. Concentration of such minerals is conducive to producing a high copper containing concentrate, which is beneficial for high payability and low off-mine charges.
Cobalt occurs with high-grade copper as both carrollite (Co2CuS4) and as cobaltiferous rims on re-crystallised pyrite grains. Preliminary geometallurgical work by Trilogy supports this observation and shows cobalt occurring primarily as cobaltiferous pyrite (approximately 80% of the contained cobalt) and within other cobalt minerals such as carrollite, and cobaltite (CoAsS) present throughout the deposit (Upper Reef, Lower Reef, and South Reef).
6.3 Resource Estimation
The project database comprises a total of 243 diamond drill (core) holes totalling 86,584 m, of which 173 holes target the Ruby Creek zone and 45 holes target the South Reef zone. Drill hole spacing at Ruby Creek varies from approximately 10 m to 20 m for underground holes and 50 m to 100 m or more for holes drilled from surface. All holes testing the South Reef zone are collared from surface and typically intersect mineralisation at approximately 100 m to 200 m spacing. The database contains a total of 32,138 samples that have been analysed for copper content and 26,574 that have been analysed for cobalt content.
Figure 6.3_1 shows an isometric view of holes drilled, colour coded for copper grade intersections.
The geological model is comprised of 17 individual phyllite domains and 15 separate carbonate domains plus separate domains representing the hanging wall Beaver Creek phyllite, the footwall quartz-phyllite Anirak Schist and the overlying overburden.
The general trend of the copper mineralisation was captured in three-dimensional wireframes, one for the South Reef units, one for the Lower Reef, and another for the Upper Reef lithologic units.
Figure 6.3_2 shows several cross sections with the trend planes as stippled lines.
As the density of drilling is insufficient in most areas to allow for the interpretation of massive sulphide domains a probability approach is used for where higher-grade mineralisation is likely to occur. Two shells were used, one with a threshold of 0.2% Cu, another of 2.0% Cu, the latter generally associated with the presence of bornite and chalcocite.
The higher-grade shell represents areas where there is greater than a 30% probability that the grade will be more than 2% copper. The lower grade shell envelopes areas where there is a greater than 50% probability that the grade will exceed 0.2% copper.
Figure 6.3_3 shows an isometric view of the Cu-probability shells.
The influence of very high-grade composite samples (2 m wide) was limited to half the drill spacing when interpolating for block grade estimation. In addition, samples inside the 2% copper probability shell in the South Reef area were top-cut to 30% copper prior to block grade interpolation.
The block size chosen is a relatively small 5 m x 5 m x 5 m, which reflects the selective mining unit (“SMU”) for underground mining.
Copper and cobalt grades in model blocks were estimated using ordinary kriging. To limit smoothing a limited number of composites were used for block grade estimation to produce reliable estimates in terms of tonnage and recoverable grade at the expense of uncertainty on a localised scale.
Figure 6.3_4 shows sections through the block model for the Ruby Creek area and the South Reef area.
As the deposit is potentially amenable to a combination of open pit and underground extraction methods, the “reasonable prospect for eventual economic extraction” was tested using a floating cone pit shell. The main assumptions used were a copper price of US$3.0/lb, unit mining cost of US$2/t moved, processing and G&A cost of US$16/t and a metallurgical recovery of 87%. The cut-off grade of resources amenable to underground extraction is based on an underground mining cost of US$65/t.
Using these parameters a pit shell was generated for the Ruby Creel area that extends to approx. 500 m below surface.
Table 6.3_1 contains the resource estimate, effective June 2018.
The table indicates that the average grades are attractive for the type of deposit: 0.98% Cu for open pit and 2.89% Cu for underground with potentially appreciable by-product revenue from cobalt should metallurgical testwork show this to be recoverable. Given the much higher grade at depth, more copper metal is contained in underground resources than open pit resources.
Figure 6.3_5 shows the two types of resources relative to each other.
6.4 Discussion of Economic Significance of Bornite
The contained copper in the Bornite resource statement is approx. three times as large as the copper contained in Arctic reserves. Using the same 87% metallurgical recovery assumed for the floating cone and a concentrate of 30%, which reflects the bornite and chalcocite content at the copper price of US$2.78 on 14 December 2018 and the same marketing terms used for Arctic total at-mine revenue of US$11.5 billion would be earned should all resources be mined. This excludes any by-product revenue from cobalt, silver and gold. In terms of revenue, this would make Bornite 60% larger than Arctic.
The at-mine value of a tonne of open pit resource is US$39 and of a tonne of underground resources it is US$115. These are values that in principle should give good cash margins indicating that Bornite is a valuable asset. It is not really possible to give a value for the project, but at a (conservative) cash margin of 40% it would generate US$4.6 billion to cover capital expenditure and taxes, exactly the same as this valuation calculates for Arctic.
Given that Bornite will be able to benefit of some of the infrastructure of Arctic (e.g. access road, some of the camp and buildings), capital intensity will be reduced.
In conclusion, the share price should reflect a considerable premium for the Bornite project over and above the value of Arctic underpinning value of Trilogy.
7. The Enterprise Value of Trilogy Metals at 14 December 2018
At the share price of C$2.46 on 14 December 2018 and with 131.53 million shares issued the market capitalisation of Trilogy is C$323.6 million, or US$241.8 million.
At 31 August 2018 the company had 9.01 million options outstanding. The company unfortunately does not give exact details on exercise prices apart from weighted average prices for a number of options. All exercise brackets are at the current share price well in the money. Furthermore 1.55 million restricted and deferred share units were outstanding at 31 August 2018.
The company has 6.52 million warrants outstanding at an exercise price of C$1.52, therefore also in the money.
At 31 August 2018 the company had net current assets of US$15.5 million and no long-term loan.
Based on the above an Enterprise Value for Trilogy of C$313.7 million (US$234.4 million) is derived as shown in Table 7_1.
As the economics of the Arctic project are very robust, and Bornite shaping up as a very attractive bulk mineable deposit, it is highly unlikely that South32 will not exercise its option by April 2020. The JV company will receive US$150 million from South32 plus a maximum of US$5 million per annum Trilogy spends on the Arctic project minus South32 contributions of US$10 million per annum to advance Arctic and Bornite. Assuming that the option will only be exercised in April 2020, the JV company will receive US$135 million.
In other words, Trilogy’s intrinsic value is half of US$135 million plus the value of Arctic and Bornite. Based on this valuation Trilogy’s share in the option cash contribution and Arctic project are worth:
½ x (US$135 million + US$803 million) = US$469 million.
The value calculated above totally ignores any value for Bornite, which is substantial.
Conclusion: the market valuation of the UKMP projects is far below their intrinsic value, probably far below half. The probable reason for this is that development of any mine is still seen as years away.
* * *
This ends the analysis of Trilogy Metals by Kees Dekker. If you have an interest in contacting Kees Dekker, this is possible through using the contact form on my website www.criticalinvestor.eu. Stay tuned for more analysis by Kees coming soon.
I hope you will find this article interesting and useful, and will have further interest in my upcoming articles on mining. To never miss a thing, please subscribe to my free newsletter, in order to get an email notice of my new articles soon after they are published.
Disclaimer:
The author is not a registered investment advisor, and has no position in this stock. Kees Dekker is also not a registered investment advisor, and has a long position in this stock. All facts are to be checked by the reader. For more information go to www.trilogymetals.com and read the company’s profile and official documents on www.sedar.com, also for important risk disclosures. This article is provided for information purposes only, and is not intended to be investment advice of any kind, and all readers are encouraged to do their own due diligence, and talk to their own licensed investment advisors prior to making any investment decisions.
This newsletter/article is not meant to be investment advice, as Criticalinvestor.eu (from now on website, newsletter, and all persons or organisations directly related to it, for example but not limited to: owner, editor, the Seekingalpha author The Critical Investor, publisher, host company, employees, associates, sponsoring companies) is no registered investment advisor. Therefore it is not intended to meet your specific individual investment needs and it is not tailored to your personal financial situation. This newsletter/article reflects the personal and therefore subjective views and opinions of Criticalinvestor.eu and nothing else. The information herein may not be complete, up to date or correct. This newsletter/article is provided in good faith but without any legal responsibility or obligation to provide future updates.
Through use of this website and its newsletter viewing or using you agree to hold Criticalinvestor.eu harmless and to completely release them from any and all liability due to any and all loss (monetary or otherwise), damage (monetary or otherwise), or injury (monetary or otherwise) that you may incur.
You understand that Criticalinvestor.eu could be an investor and/or active trader, meaning that Criticalinvestor.eu could buy and sell certain securities at all times, more specific any or all of the stocks mentioned in own newsletters/articles and other own content like the Watchlist, Leveraged List, etc.
No part of this newsletter/article may be reproduced, copied, emailed, faxed, or distributed (in any form) without the express written permission of Criticalinvestor.eu. Everything contained herein is subject to international copyright protection. The full disclaimer can be found here.