Tim Oliver: Nearly half of development-stage NI 43-101 studies surveyed lack engineering rigor
This article was republished with permission from Exploration Insights.
Exploration Insights
by Brent Cook
www.explorationinsights.com
Issue No. 342
September 13, 2015
This week our go-to mining engineer, Tim Oliver, discusses the results of his investigation into 34 recently published National Instrument 43-101 technical reports. These reports are mining disclosure standards implemented by the Ontario Securities Commission for Canadian-listed companies. As Tim points out, an NI 43-101 compliant report does not guarantee the results are accurate or correct, it only means the report is in accordance with the regulations regarding what is included and how it is presented in the document by a Qualified Person (QP). To be compliant, these reports must be filed with a Canadian securities regulator and are posted on SEDAR.com. It’s a long rant, but worthwhile for anyone not familiar with the positives and pitfalls of NI 43-101.
I also want to draw your attention to an excellent interview posted by The Energy Report, here, in which Blair Way (President Flinders Graphite) provides some very useful insights into the graphite market. As you may recall, graphite was the metal du jour a couple of years back, but it has since run smack into the realities of mining and marketing specialty metals. To its credit, Flinders actually has a functioning plant with a marketable product, and is ready to go when graphite prices increase.
A reminder, the annual New Orleans Investment Conference runs from October 28 to 31 this year. In my opinion it is one of the best, if not the best, hard asset-big picture investment conferences in the world for those interested in an alternative view to mainstream economic views with a bit of conservative-nut job politics thrown in. I will also be chairing the Insights into Exploration panel Wednesday afternoon. Detailshere.
Analysis of 34 Technical Studies
By Tim Oliver
First published in Exploration Insights on September 13, 2015.
Background
In March 2014 I wrote a two-part series for Exploration Insights titled “Top 10 Signs of a Bogus NI 43-101 Study”. I presented a slide show on the subject to the crew at Sprott Global Resource Investments Ltd. in Carlsbad, California. The presentation went well until the end. Steve Todoruk asked me what percentage of posted studies is actually bogus. I made what I thought was a reasonable guess. It was pretty high, and I could feel the room drifting away. Most didn’t believe me, and I felt I lost credibility.
The subject haunted me from that day. So, having some time on my hands, and looking for a way to promote my services, I decided to find out.
Introduction
This article describes the results of an analysis of 34 advanced NI 43-101 studies, Preliminary Economic Assessments (PEA), Pre-feasibility Studies (PFS) and Feasibility Studies (FS) that were posted on SEDAR during the period May 1 to August 31, 2015.
The purpose of the study was to:
- Count how many of each category of study are issued by Canadian Junior Mining Companies during a given period of time,
- Review the studies for adequacy and quality according to criteria discussed below, and
- Collect data and prepare a snapshot picture about the companies, the mining and processing methods, the commodities, and the geography of the Canadian Junior Mine development world.
- Equip investors with study analysis tools so they can avoid companies with projects facing cost overruns. Inevitably, cost overrun means some level of investment loss. An example is Midway Gold, a failure foreshadowed during the feasibility study review for the “Top 10 Signs” article referenced above. Midway’s FS scored 45.
Findings
According to the methodology discussed below,
- 13 of 34 studies are not suitable as a basis for an investment decision. Another 6 are borderline.
- The target audience, investors, would benefit from studies with more engineering rigor, especially in the areas of project execution planning, engineering documentation and, in particular, scheduling.
- Investors would also benefit from more complete explanations of the basis for operating and capital costs.
- Investors need to be alert to contingency calculations. Too low a contingency means the financial model results are too rosy.
- Counter to what I had previously thought, overstating metallurgical recovery does not appear to be a major cause of concern.
- 23 of 34, or 67%, passed the “qualified” part of Qualified Person. That number should be 100%. Investors should closely examine the QP credentials. Beware if one person wears too many hats.
Assumptions/Limits
This paper evaluates development-stage studies. It does not address the deposit/the resource.
In my experience, investors focus most closely on the geology and resource statements, and that is proper. It’s impossible to engineer a profitable mine without a good deposit. Unfortunately, I find investors take a leap of faith on the project development engineering, assuming the signoff by a QP engineer guarantees the soundness of the engineering.
I first set out to show how QP signoff doesn’t guarantee engineering rigor, and to offer some tools for investors to peer into the “black box” of engineering studies.
This paper ventures further, by actually evaluating a selection of studies based on standards by which I judge the reports as objectively as I can. Those judgments are the subject of the report.
Ironically, since I don’t evaluate the geology and resources, I must make my own leap in assuming geology and resources were adequately addressed in the resource reports prior to the owner launching the development study.
It’s a catch 22. Perhaps a reader will offer a remedy.
Methodology
The first task was to figure out a methodology. Well, I already had the “top ten” list. Here it is:
- QP Conflict of Interest (10)
- QP Qualifications (10)
- Commodity Price Deck (5)
- Unrealistic Metallurgical Recoveries (6)
- Signs of Desperation (5)
- Lack of Engineering Documentation (10)
- Unrealistically Low Contingency (7)
- Cost Basis Discussion (10)
- Missing or Unrealistic Project Schedule (10)
- New or Exotic Technology (5)
I decided to use these ten criteria as the basis for a grading system. The numbers in parentheses are weighting factors, or relative importance, for each item. For example, a good cost basis discussion is worth 10 points, while using new or exotic technology costs five points.
I then went onto SEDAR and began the tedious process of downloading studies. The system is set up for search by various means. You can enter the company, or leave it blank, which I did; I specified “Technical Report” and started with May 1.
The query results included all the PEAs, PFSs and FSs posted during the specified period. The query also included every Resource Report, Property Assessment and all QP Consent Forms for the reports caught in the search net.
By various means I streamlined the process and eventually settled on a sample universe of all the reports spanning the period from May 1 to August 31, 2015. That gave me about 39 reports. I culled out some that were irrelevant such as the slick FS produced by non-Junior companies to fulfill the regulatory requirements and to justify their budgets to Management. They are interesting but not relevant to my survey. I also discarded a report on a sand and gravel operation, and some studies designed only to report on a specific aspect or change to an ongoing project or operation: for instance, adding a flotation stage to a Mother Lode district mine to improve recovery. I wanted studies by Juniors for greenfields projects.
I reviewed each report in considerable detail. Sometimes I could get through a good PEA in just a few hours. Many FSs require more than a full day. Good quality studies are easier to review than poor-quality studies, as it’s easier to find information. With a lousy study I would waste a good deal of time making sure what I was looking for wasn’t there. Did they call it a schedule, timeline, execution plan, what? Is it there or not? Usually if you need to search hard, it isn’t there.
I gave each study a 1 or a 0 for the ten items: pass/fail.
Each item received a weighting factor. Those are the numbers in parentheses next to each top ten item in the list above. The weighting factors are based on how important I think the criteria is and how well I am able to assess it. For example, I know when a metallurgical recovery is comically high, but I can’t distinguish between 96.8% or 97.8% gold flotation/CIL recovery. I might look through the testing and find a flaw, but unless the stated recovery is obviously wrong, I score a 1.
I use a different standard for each level of study. PEAs don’t require much engineering or detailed infrastructure plans. FS require specific engineering drawings, criteria and specifications.
RugePincockMinorco (RPM) published an excellent guide (click on title) to the differences between the study levels in their June 2015 Newsletter: “Minimum Engineering Study Requirements Update.”
My guide and the source of my checklists is, “Project Management for Mining-Handbook for Delivering Project Success, Robin J. Hickson and Terry L. Owen, 2015, SME.” (“Project Success Handbook” hereafter) I swear by this resource and have hardcover and electronic editions so I’m never without it. The book succinctly lists nearly everything required for each level of study and explains why.
As it turned out, the maximum score possible is 78. Two of the 34 studies achieved perfect scores.
Anything lower that 50 flunks the test. If the score is between 50 and 60, be cautious. Four studies scored 51. Be very cautious.
Results
Figure 1 shows a frequency distribution for the score ranges in increments of 10 points.
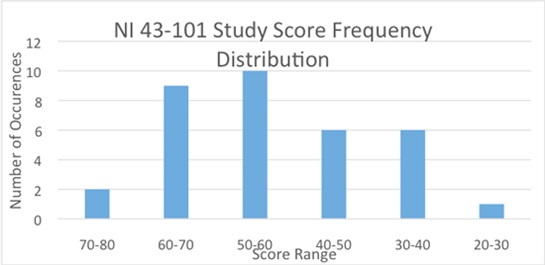
Figure 1
Scoring Summary

Weak Areas
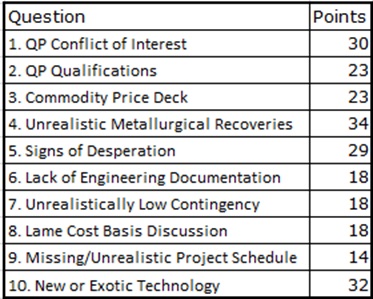
The points shown are the total number of studies, out of 34, that pass the test question.
Project Schedule
Fewer than half (14 of 34) the studies presented acceptable and believable project schedules. Not only is this the weakest area, but it is also, in my opinion, the most crucial criteria.
Schedule trumps all. Frequent readers know my belief that a project on schedule will likely be successful and on budget, and a project off schedule almost certainly won’t make budget and has a poor chance of success.
All projects, even PEAs, should be considered in terms of what it will take to make them successful—a project execution plan. The first thing in the plan is a schedule. It’s very rare to see a Project Execution Plan in a PEA, but even the PEA needs a coherent project schedule.
To fail in this category, a study must either have no schedule at all, or have an unrealistic schedule. A PEA need only have a narrative describing estimated time lines for permitting, design, procurement, construction and commissioning. This is not difficult. In my opinion, no seasoned study engineer should release a study without a clear project schedule.
Some of the PEAs received credit only because the economic model table showed two years for construction. After some debate with myself, I decided, at PEA level, allotting construction time on the economic model spreadsheet is the bare minimum amount of scheduling to pass. If the economic model shows one year for construction, I usually give no credit. Ordinarily a mine can’t be built in a year. There is one small heap leach with less than a year of construction shown on a well-presented schedule for a FS. It is really small, has a CEO with solid credentials in building mines, and has no real infrastructure challenges. So it passed.
Cost Basis Discussion
Just half of the studies included an acceptable cost basis discussion. Some studies simply list costs in a table. In my opinion, even a PEA needs a narrative description of the origin of the cost numbers. For example, PEA-level capital costs for a simple heap leach project in Nevada with no major infrastructure challenges can be estimated by benchmarking similar projects. If the PEA says, “Project x, y and z are very similar to the subject project. We used the as-built cost for Projects x, y and z, escalated for inflation, and scaled for the difference in project size, as the basis for a $/tonne processed factor to calculate the likely cost for the subject project.” That’s fine. Benchmarking is a legitimate cost estimating tool and is accurate enough for a PEA. The reader will know exactly where the cost numbers came from.
A more obscure commodity might require more work. For example niobium is the sought-after commodity in one of the projects studied. The PEA for that project required a bottom-up approach with extensive test work, process design, equipment specification and price quotes; a similar procedure as required for advanced studies (PFS, FS) of more common commodities.
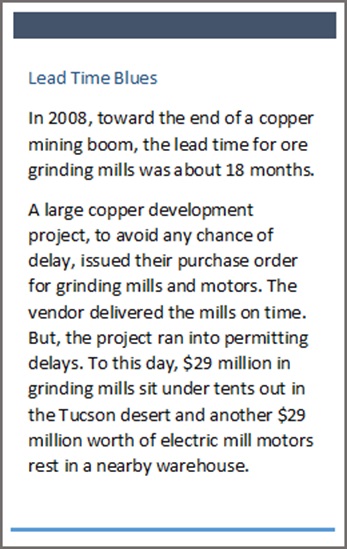
A PFS or FS should declare what percentage of the total equipment cost was derived from vendor quotes. That isn’t difficult to do. A few pieces of major equipment easily make up the majority of the equipment cost. Vendor quotes are the best source of up-to-date equipment costs. In a PFS or FS, at least 90% of the total mechanical equipment cost should come from vendor quotes.
The vendor will also provide the lead time for the equipment. A PFS or FS Project Schedule should indicate lead times for major equipment. As of today, the lead time for a large SAG mill gearless motor, the longest lead time item for most large projects, is about 18 months.
The point is, there is no set formula or template for the cost estimates, and that is why a clear, detailed explanation is essential. The explanation narrative is typically called the “Basis of Capital [Operating] Cost Estimate.”
Engineering Documentation
It should be obvious that an engineering study needs to show a little engineering. Yet only half of the studies showed adequate engineering support. Even a PEA needs a site plan, including plant layout with locations for major buildings, equipment installations, infrastructure features, mine facilities including shafts, adits and other openings. The engineer must demonstrate that the facilities required to exploit the deposit can actually fit and function on and in the surface topography.
PFS and FS should show detailed annual pit plans and cross sections along with General Arrangements and select cross sections for process plants.
A PEA can assume a pit slope angle. A PFS may refine the estimate by evaluating the rock type. A FS must conduct geotechnical studies including cell mapping and oriented core drilling to calculate expected actual slope angles.
PFS and FS should show road alignments and cross sections. The FS should show storm water best management practices (BMPs).
A simple block diagram is sufficient for a PEA Process Flow Diagram, but a PFS or FS requires separate flow diagrams for each process stage such as crushing, grinding, flotation, etc.
PFS and FS require a detailed equipment list. What equipment will be used, what size, how many, what size motors? The FS should include a Quote Log showing which vendors submitted which quotes, which were selected and why.
PFS and FS require design criteria including mass balance numbers, specific gravity, pulp densities, residence times, etc.
PFS and FS need electrical one-line diagrams and load studies.
These are just a few examples, not a full list.
Some documentation might be too large (in terms of bytes) for posting on SEDAR. The posted study should list all appendices so the reviewer knows the work was done and can access the documents if necessary. That said, with a bit of care the posted study and all appendices can be made to fit within SEDAR document size guidelines.
Odds and Ends
Here are some fun facts reflecting on the current status of the business.
CEOs
I once jokingly characterized Canadian Juniors as three geologists with a mail drop in Vancouver. One is too old to travel, one is drilling in the jungle and the third is somewhere raising money.
If that was ever correct, it is not correct today. Of the 34 companies whose project studies were reviewed, nine CEOs were engineers, ten were geologists, 13 were financial types and two were either professional administrators or mine operations professionals not otherwise specified.
Commodities
21 of the 34 studies were gold projects. Two were primarily silver, two were primarily copper, two were frac sand, and two were rare earths. Lead/zinc, phosphate, niobium, alumina, and scandium, added one each.
Geography
Surprisingly, the USA hosted the most projects, with eight. Ghana and Canada tied for second with three each, Mexico and Ghana had two, and the hot bed of mining, Peru, only had one.
Continent Count
North America 16
Africa 8
South America 4
Europe 3
Oceana 1
Greenland 1
Australia 1
Conclusion
This semi-qualitative analysis showed nearly half of the development stage NI 43-101 studies lack engineering rigor. A Qualified Person’s signature does not guarantee reliable results. Investors can avoid losses if they undertake an independent engineering review of a project’s NI 43-101 study before handing over their money.
If and when investors demand more rigor in these studies, the owners and engineers will need to step up their game. Everyone will benefit.
My next move will be to prepare a detailed report including names of companies and projects, and the raw scores. If I can generate enough interest, the report will become a regular, quarterly, service available for a cost to be determined.
Tim Oliver
tim@timoliver.us
A Mine is a Terrible Thing to Waste
In the preceding discussion Tim makes the point early on that, ironically, “I must make my own leap in assuming geology and resources were adequately addressed in the resource reports prior to the owner launching the development study.”
The geology and resource estimate form the basis of any mining study. If there is a mistake there, it is highly unlikely the mining and cost sides of a technical study will be right.
By coincidence, Goldcorp published a presentation on its Eleonore gold deposit in advance of an analyst tour that revealed a few surprises related to its resource modeling.
Eleonore is a high-grade underground mine with proven and probable reserves of 4.97 million ounces grading 6.30 grams per tonne gold (plus inferred 2.8mil oz @ 7.19g/t Au) that reached commercial production in April. Development and construction were supported by an in-house, 43-101 compliant technical report that ran 246 pages plus supporting documentation. Initial capex came to about US$2.04 billion and Goldcorp paid US$420 million for the deposit.
In the deeper portion of the orebody, Goldcorp is encountering more structural complexity than was modeled in the resource estimate. Specifically, the ore zones that were interpreted as relatively planar are, in fact, ductilely folded (Figures 2 and 3). The folding affects about 20% of the deeper reserves (~10% of total reserves).

(Fig. 2: Modeled vein shape vs. developed vein shape)
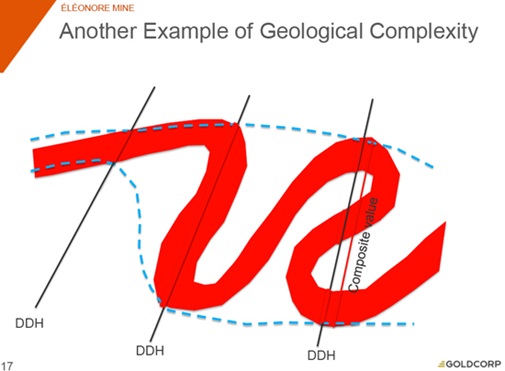
(Fig. 3: Complexly folded vein and drill hole traces)
Note how the three drill holes each seem to demonstrate a different vein character. These are spaced about 25 meters apart.)
The net affect of this newly recognized structural complexity is that in these zones the mine dilution increases, which means head grade drops and mining costs increase on a per ounce basis. In figure 2, Goldcorp estimates the grade drops by 25% and tonnes mined increases by 60% because of the additional rock that has to be mined to extract the ore.
A word on dilution:
The prime objective of any mining operation is to mine as much ore and little waste as possible–ore makes money, waste costs money. When mining an ore body there is almost always uneconomic rock that has to be extracted in order to efficiently mine the deposit. When mined it is called dilution because it is processed with the ore and lowers (dilutes) the grade going to the processing plant. For instance, if your ore zone is a 1-meter wide vein that grades 30 g/t Au but the mining width is 2 meters, that extra meter of rock dilutes the grade going to the mill. For simplicity, if the additional meter grades 0 g/t Au then the mined grade is diluted to 15 g/t Au.
I find it instructional that even a top group of estimators and engineers in one of the largest and most successful gold companies did not recognize the structural complexity until they were in it. It seems that, more often than not, when a problem arises in a resource estimate or engineering aspect of a mine it has a negative effect on the mine’s economics. That is just how Earth works and why one has to be especially diligent when assessing marginal or technically difficult deposits. If Eleonore were a marginal deposit owned by a junior miner (it’s not), it could go the way of: Adanac Moly, Mercator, Midway, Jaguar, Carpathain, Great Basin Gold, Orvana, San Gold, Allied Nevada, Colossus, Royal Oak, Aurcana, Equitorial, South Deep, Tabakota, Twin Buttes, Lisbon Valley, Oracle ridge, Silver Lake. . .you get the point.
There are of course, many many more mines that work than don’t but we still must be very diligent when reviewing a resource estimate, folks.
This newsletter/article is not meant to be investment advice, as Criticalinvestor.eu (from now on website, newsletter, and all persons or organisations directly related to it, for example but not limited to: owner, editor, the Seekingalpha author The Critical Investor, publisher, host company, employees, associates, sponsoring companies) is no registered investment advisor. Therefore it is not intended to meet your specific individual investment needs and it is not tailored to your personal financial situation. This newsletter/article reflects the personal and therefore subjective views and opinions of Criticalinvestor.eu and nothing else. The information herein may not be complete, up to date or correct. This newsletter/article is provided in good faith but without any legal responsibility or obligation to provide future updates.
Through use of this website and its newsletter viewing or using you agree to hold Criticalinvestor.eu harmless and to completely release them from any and all liability due to any and all loss (monetary or otherwise), damage (monetary or otherwise), or injury (monetary or otherwise) that you may incur.
You understand that Criticalinvestor.eu could be an investor and/or active trader, meaning that Criticalinvestor.eu could buy and sell certain securities at all times, more specific any or all of the stocks mentioned in own newsletters/articles and other own content like the Watchlist, Leveraged List, etc.
No part of this newsletter/article may be reproduced, copied, emailed, faxed, or distributed (in any form) without the express written permission of Criticalinvestor.eu. Everything contained herein is subject to international copyright protection. The full disclaimer can be found here.