Brent Cook on Rubicon Minerals
Republished with permission of Brent Cook on October 11, 2015:
Brent Cook on Rubicon Minerals
Rubicon Minerals (RMX.T, RBY.NYSE) got hammered this week after, 1) announcing milling operations had been temporarily suspended by the Ministry of Environment and Climate due to elevated ammonia being discharged into the tailings pond; and, 2) its President and CEO, Michael Lalonde, bailed. The share price dropped from ~C$1.00, to close at C$0.68 on Friday (Fig. 3). Of note is that, 1) SRK (Feb 2014) recommended further test work and optimization to keep the ammonia effluent within guidelines; and, 2) RMX failed to disclose that it was issued a notice from the Ministry regarding ammonia discharge back on September 8.
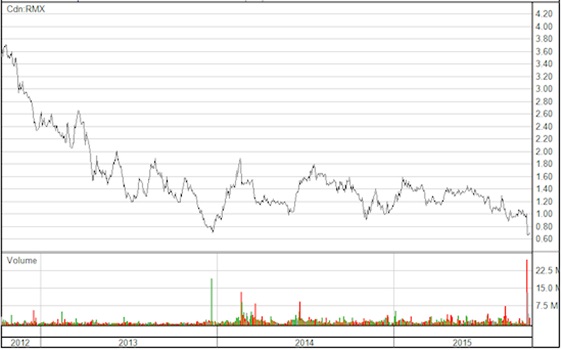
(Fig. 3: Three-year chart of RMX. Not a pretty picture for one of Canada’s favorite mining stories)
Prior to this week’s news nine sell-side analysts and two newsletters recommended the stock, with target prices between C$1.20 and C$2.00. With the drop in share price we have received a number of queries from subscribers, and someone’s mom, wondering if the current RMX share price represents a buying opportunity.
In short, I ain’t touching it
In long, I have reviewed Rubicon’s Phoenix gold deposit in the Red Lake District, Ontario a few times but was never comfortable with the resource estimate or some of the assumptions of the preliminary economic analysis (PEA) authored by SRK. For today’s discussion I also owe some thanks to a few shall-remain-anonymous, but top, analysts and geologists and Tim Oliver who all opined on Rubicon’s issues over the week.
Although the Phoenix deposit occurs in the Red Lake District proper, the alteration and structural setting is considerably less developed than the very high grade Red Lake deposit owned by Goldcorp (current P&P 2mil oz @ 10g/t Au, M&I 2.3mil oz @ 17g/t Au, including a high grade core of over 60g/t Au). There is little comparison between the two with regards to the intensity of mineralization.
Phoenix is not a simple high-grade deposit. Pulling from the SRK 2014 PEA, “The current mining plan envisions a complex deposit that is relatively discontinuous, somewhat disseminated in nature, has weak visual indicators, and a strong nugget factor.” The direct implication of this on mining is that miners cannot visually differentiate between ore and waste (it’s all black and grey rock), and they cannot even follow a structure, as the mineralization comes and goes over very short distances. The PEA goes on to state that (Fig. 4):
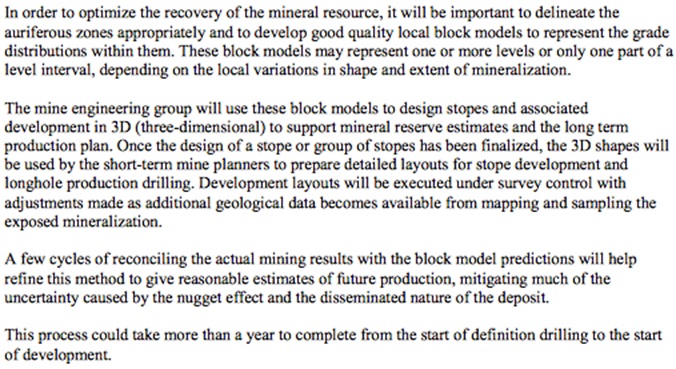
(Fig. 4: Pg. 94, SRK PEA notes that until a year of test mining is complete and reconciled to the resource estimate, they have no reasonable clue what future production will be—not terribly reassuring.)
SRK also points out that to successfully mine the deposit will require a high level of geological effort to understand the mineralization trends over very short distances. “This complex deposit will challenge the mine engineers to develop and employ a comprehensive ‘tool box’ of mining solutions. This will require the employment of multiple mining methods and variations on those mining methods to deal with the situations where the mineralization is not continuous to the next level and has an irregular geometry.” Meaning, this is going to be a real bitch to mine.
Resource
The company has produced three resource estimates since 2010. The first, by Peter George of Barkerville fame (see EI Feb. 20, 2011 and EI Aug. 19, 2012), estimated an inferred 4 million ounces grading 20 grams per tonne gold plus a “total geologic potential” of 13.3 to 16.1 million ounces grading 24.4 to 26.8 grams per tonne gold (we’ll call this the Tea Party estimation methodology). AMC produced a revised and improved estimate in 2011 of an indicated 0.5 million ounces grading 14.5 grams per tonne gold, plus an inferred 2.3 million ounces grading 17 grams per tonne gold. In 2013 SRK estimated an indicated 1.1 million ounces grading 8.5 grams per tonne gold, plus an inferred 2.2 million ounces grading 9.3 grams per tonne gold. The SRK estimate was really not much different from the AMC, but appears more conservative due to changes in the cutoff grade, etc. All the reports are severely lacking in critical information necessary to completely evaluate the estimates (e.g., coordinates, from-to intervals, sections, and surveys).
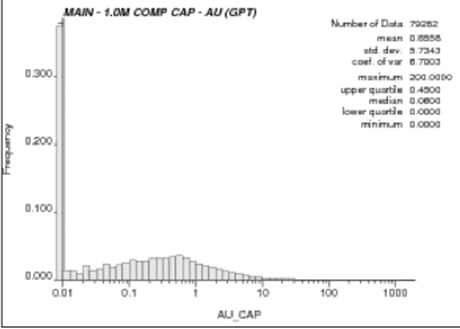
With that caveat out of the way and using the data at hand, it appears that the two most recent estimates have blown high-grade assays into low or zero grade blocks—meaning they put ore where there is none. The 1-meter composited histogram (Fig. 5 below) is very scary. Consider: the cutoff grade is 5 g/t and average grade ~10 g/t, yet ~40% of the composites are 0 grade, and less than 1% are greater than 10 g/t. The entire resource is being carried by a very few high-grade assays.
Additionally, drilling focused on higher-grade zones, so it is probably more extreme than shown below. For the geo-statisticians in the crowd, there are 56 ore domains modeled, and the coefficient of variation (CV) runs between 11.8 and 59—these are very high, unusual numbers-- which means the estimation methodology needs very tight geological control (which it doesn't seem to have).
(Fig. 5: 1-meter comp frequency distribution plot. Note very few assays above 10g/t)
Driving the point home, Fig. 6 below is a cross section through the ore-body, illustrating drill holes and individual assays. Note the small scale (50 m squares) and intensity of drilling:
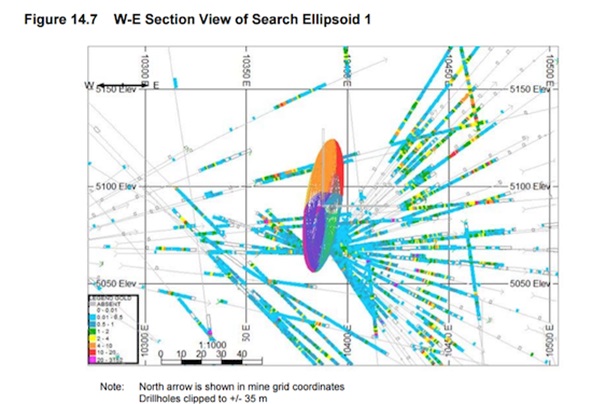
(Fig. 6: Cross section showing drill holes and individual assays. Note scale.)
At a mine cutoff grade of 4 grams per tonne gold (they are using 5g/t now), the only ore intervals are colored orange, red, and pink. Even at this map scale, it is virtually impossible to connect the orange or better intersections, and my bet is that the final diluted grade delivered to the mill will be substantially lower than predicted. The company was running a trial stope mining program to reconcile results against the resource estimate. The trial stope mining has been delayed by two to four weeks because of the mill shutdown. It will probably be mid-2016 before we have any sense of how the mined deposit reconciles with the modeled deposit.
Costs and Valuation
The SRK 2014 PEA estimates underground mine costs will be C$89.60/tonne, process costs of C$28.12/tonne, and G&A of $32.22/tonne, for a total on-site operating cost per tonne milled of C$149.94.
I don't buy it.
Goldcorp reports mining costs of C$233.36/tonne and process costs of C$47.37/tonne from its nearby Red Lake deposit. Red Lake has been operating for over a decade, is a somewhat simpler deposit, and has a skilled workforce that knows the deposit well. Rubicon is starting from ground zero on a PEA-level study, and has not even determined what mining method will work best on this complex deposit.
The 2014 PEA estimates a base case ($1,385 gold at a C$1/US$1.05 exchange rate) post-tax NPV5% of C$531 million and IRR of 27%. At a $1,108 gold price, the NPV drops to C$206 million. Rubicon states the PEA is conservative, as it employs a low diluted grade, low sustaining capex, and low recovery, plus a high C$ exchange rate; and therefore the project is deemed “low risk”. Rubicon has sunk in excess of C$600 million into the deposit, has a market cap of ~C$270 million, and ~C$59 million in debt.
Summary
If the resource is wrong and the costs wrong, then the valuation presented in the PEA must be wrong. Cash flow problems, debt problems, and production problems on a deposit of dubious resources, questionable costs, plus a new guy in charge don't add up to a screaming buy. Someone’s mom is going to be very disappointed as this slow motion calamity unfolds—or maybe it all works out just fine. (-:
This newsletter/article is not meant to be investment advice, as Criticalinvestor.eu (from now on website, newsletter, and all persons or organisations directly related to it, for example but not limited to: owner, editor, the Seekingalpha author The Critical Investor, publisher, host company, employees, associates, sponsoring companies) is no registered investment advisor. Therefore it is not intended to meet your specific individual investment needs and it is not tailored to your personal financial situation. This newsletter/article reflects the personal and therefore subjective views and opinions of Criticalinvestor.eu and nothing else. The information herein may not be complete, up to date or correct. This newsletter/article is provided in good faith but without any legal responsibility or obligation to provide future updates.
Through use of this website and its newsletter viewing or using you agree to hold Criticalinvestor.eu harmless and to completely release them from any and all liability due to any and all loss (monetary or otherwise), damage (monetary or otherwise), or injury (monetary or otherwise) that you may incur.
You understand that Criticalinvestor.eu could be an investor and/or active trader, meaning that Criticalinvestor.eu could buy and sell certain securities at all times, more specific any or all of the stocks mentioned in own newsletters/articles and other own content like the Watchlist, Leveraged List, etc.
No part of this newsletter/article may be reproduced, copied, emailed, faxed, or distributed (in any form) without the express written permission of Criticalinvestor.eu. Everything contained herein is subject to international copyright protection. The full disclaimer can be found here.